[Palantir Foundry] Titanic Survivor Prediction Project (2/2) — Model Training & Workshop Dashboard
Train a baseline model in Foundry Code Workspaces (JupyterLab), export predictions for Kaggle, and build a simple dashboard in Workshop using Ontology.
This post continues from Part 1 (preprocessing). Using
titanic_cleaned_train, we go through: (1) model training in JupyterLab → (2) Kaggle submission → (3) visualization with a Workshop dashboard.
1. Create a Code Workspace (JupyterLab)
1) Go back to the Titanic project home and select Application.
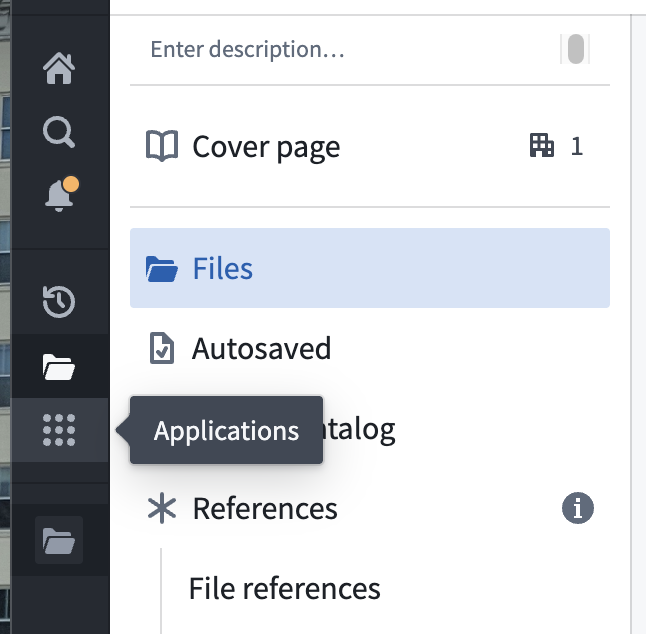
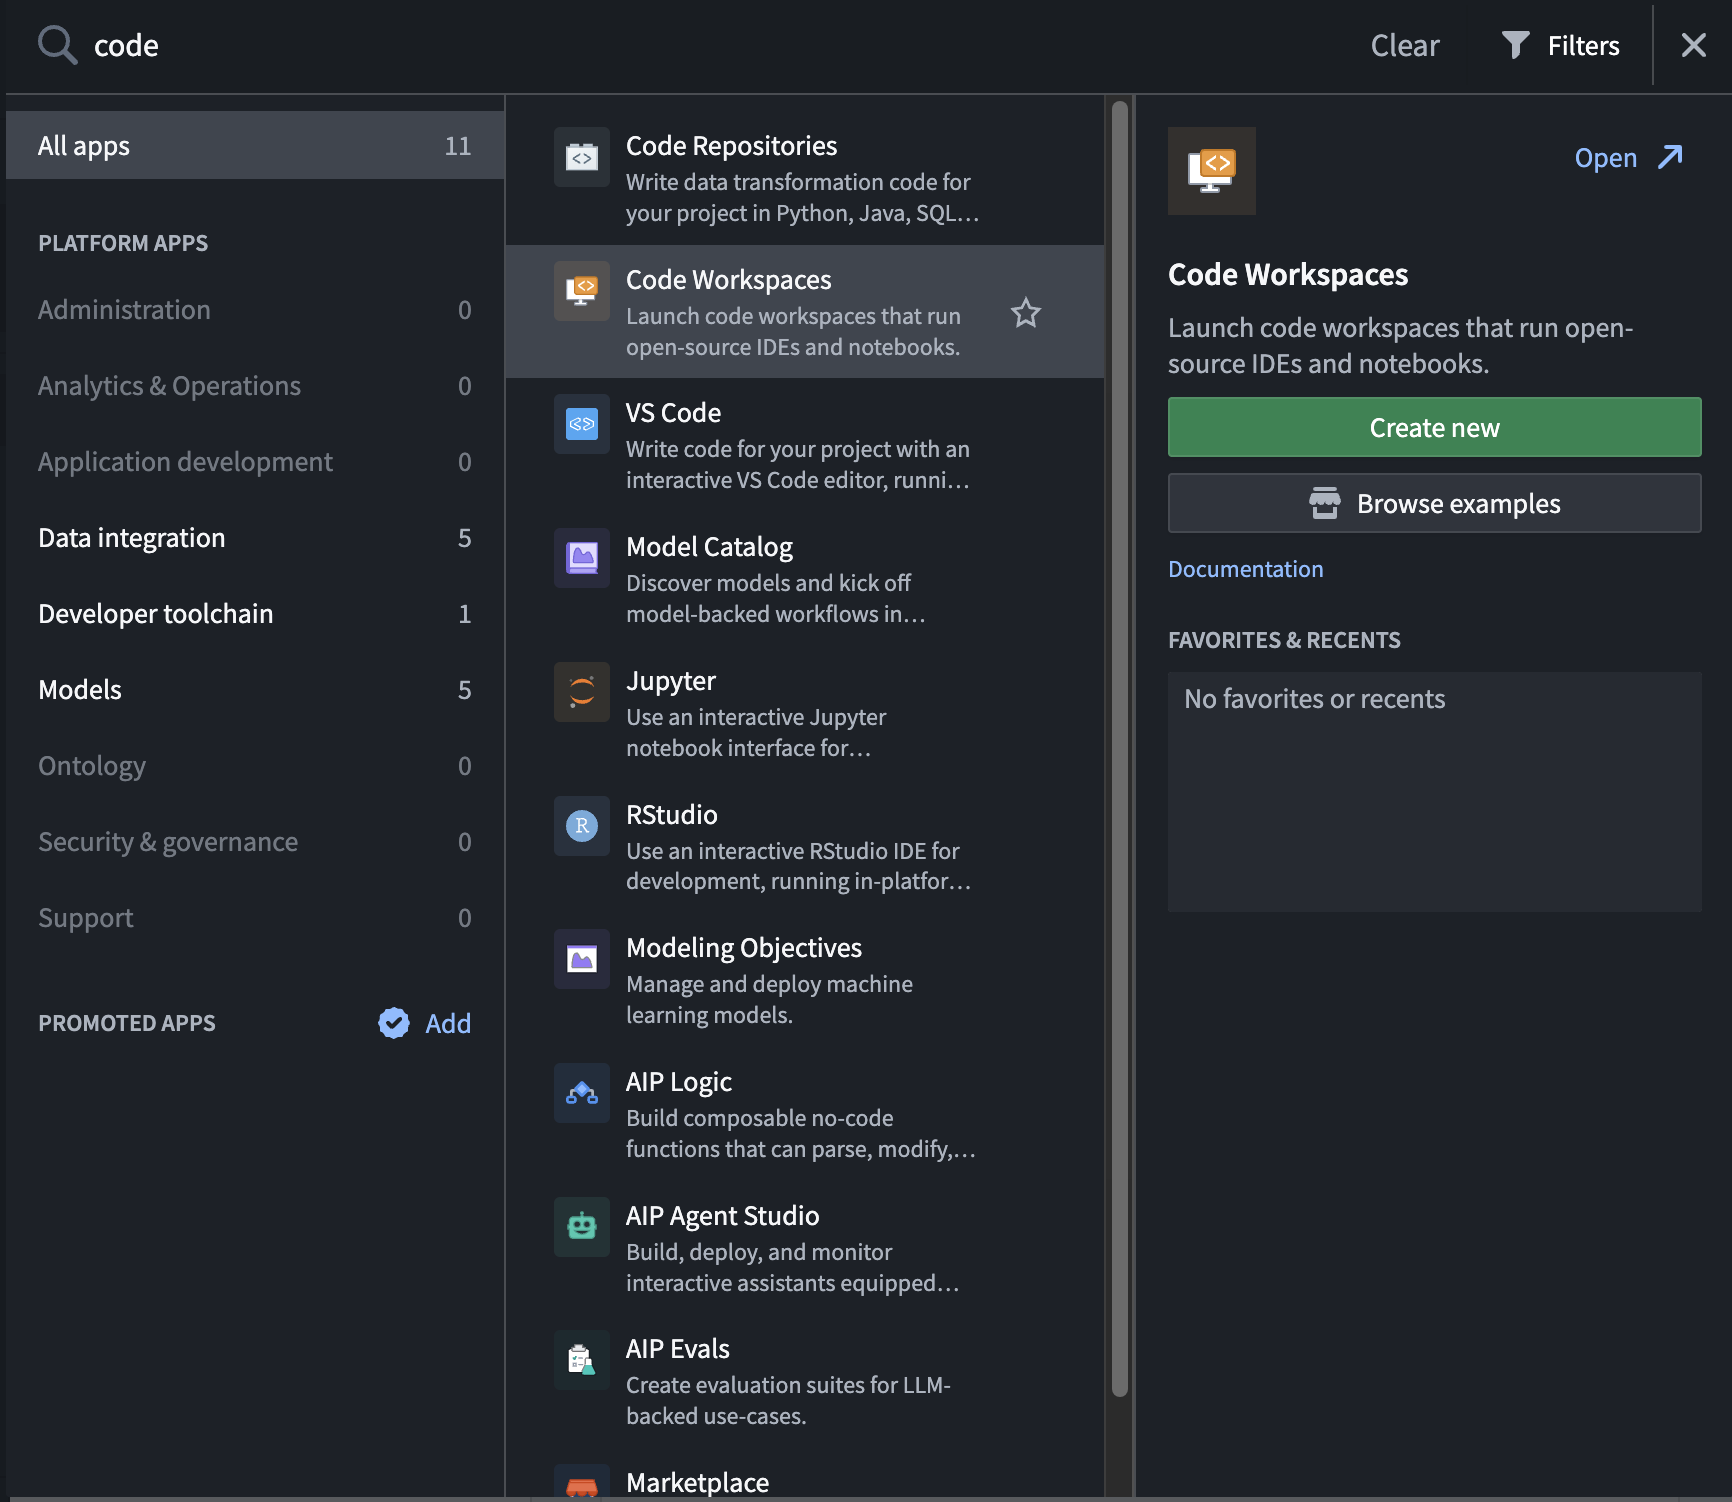
2) Search for code → open Code Workspaces → click Create new.
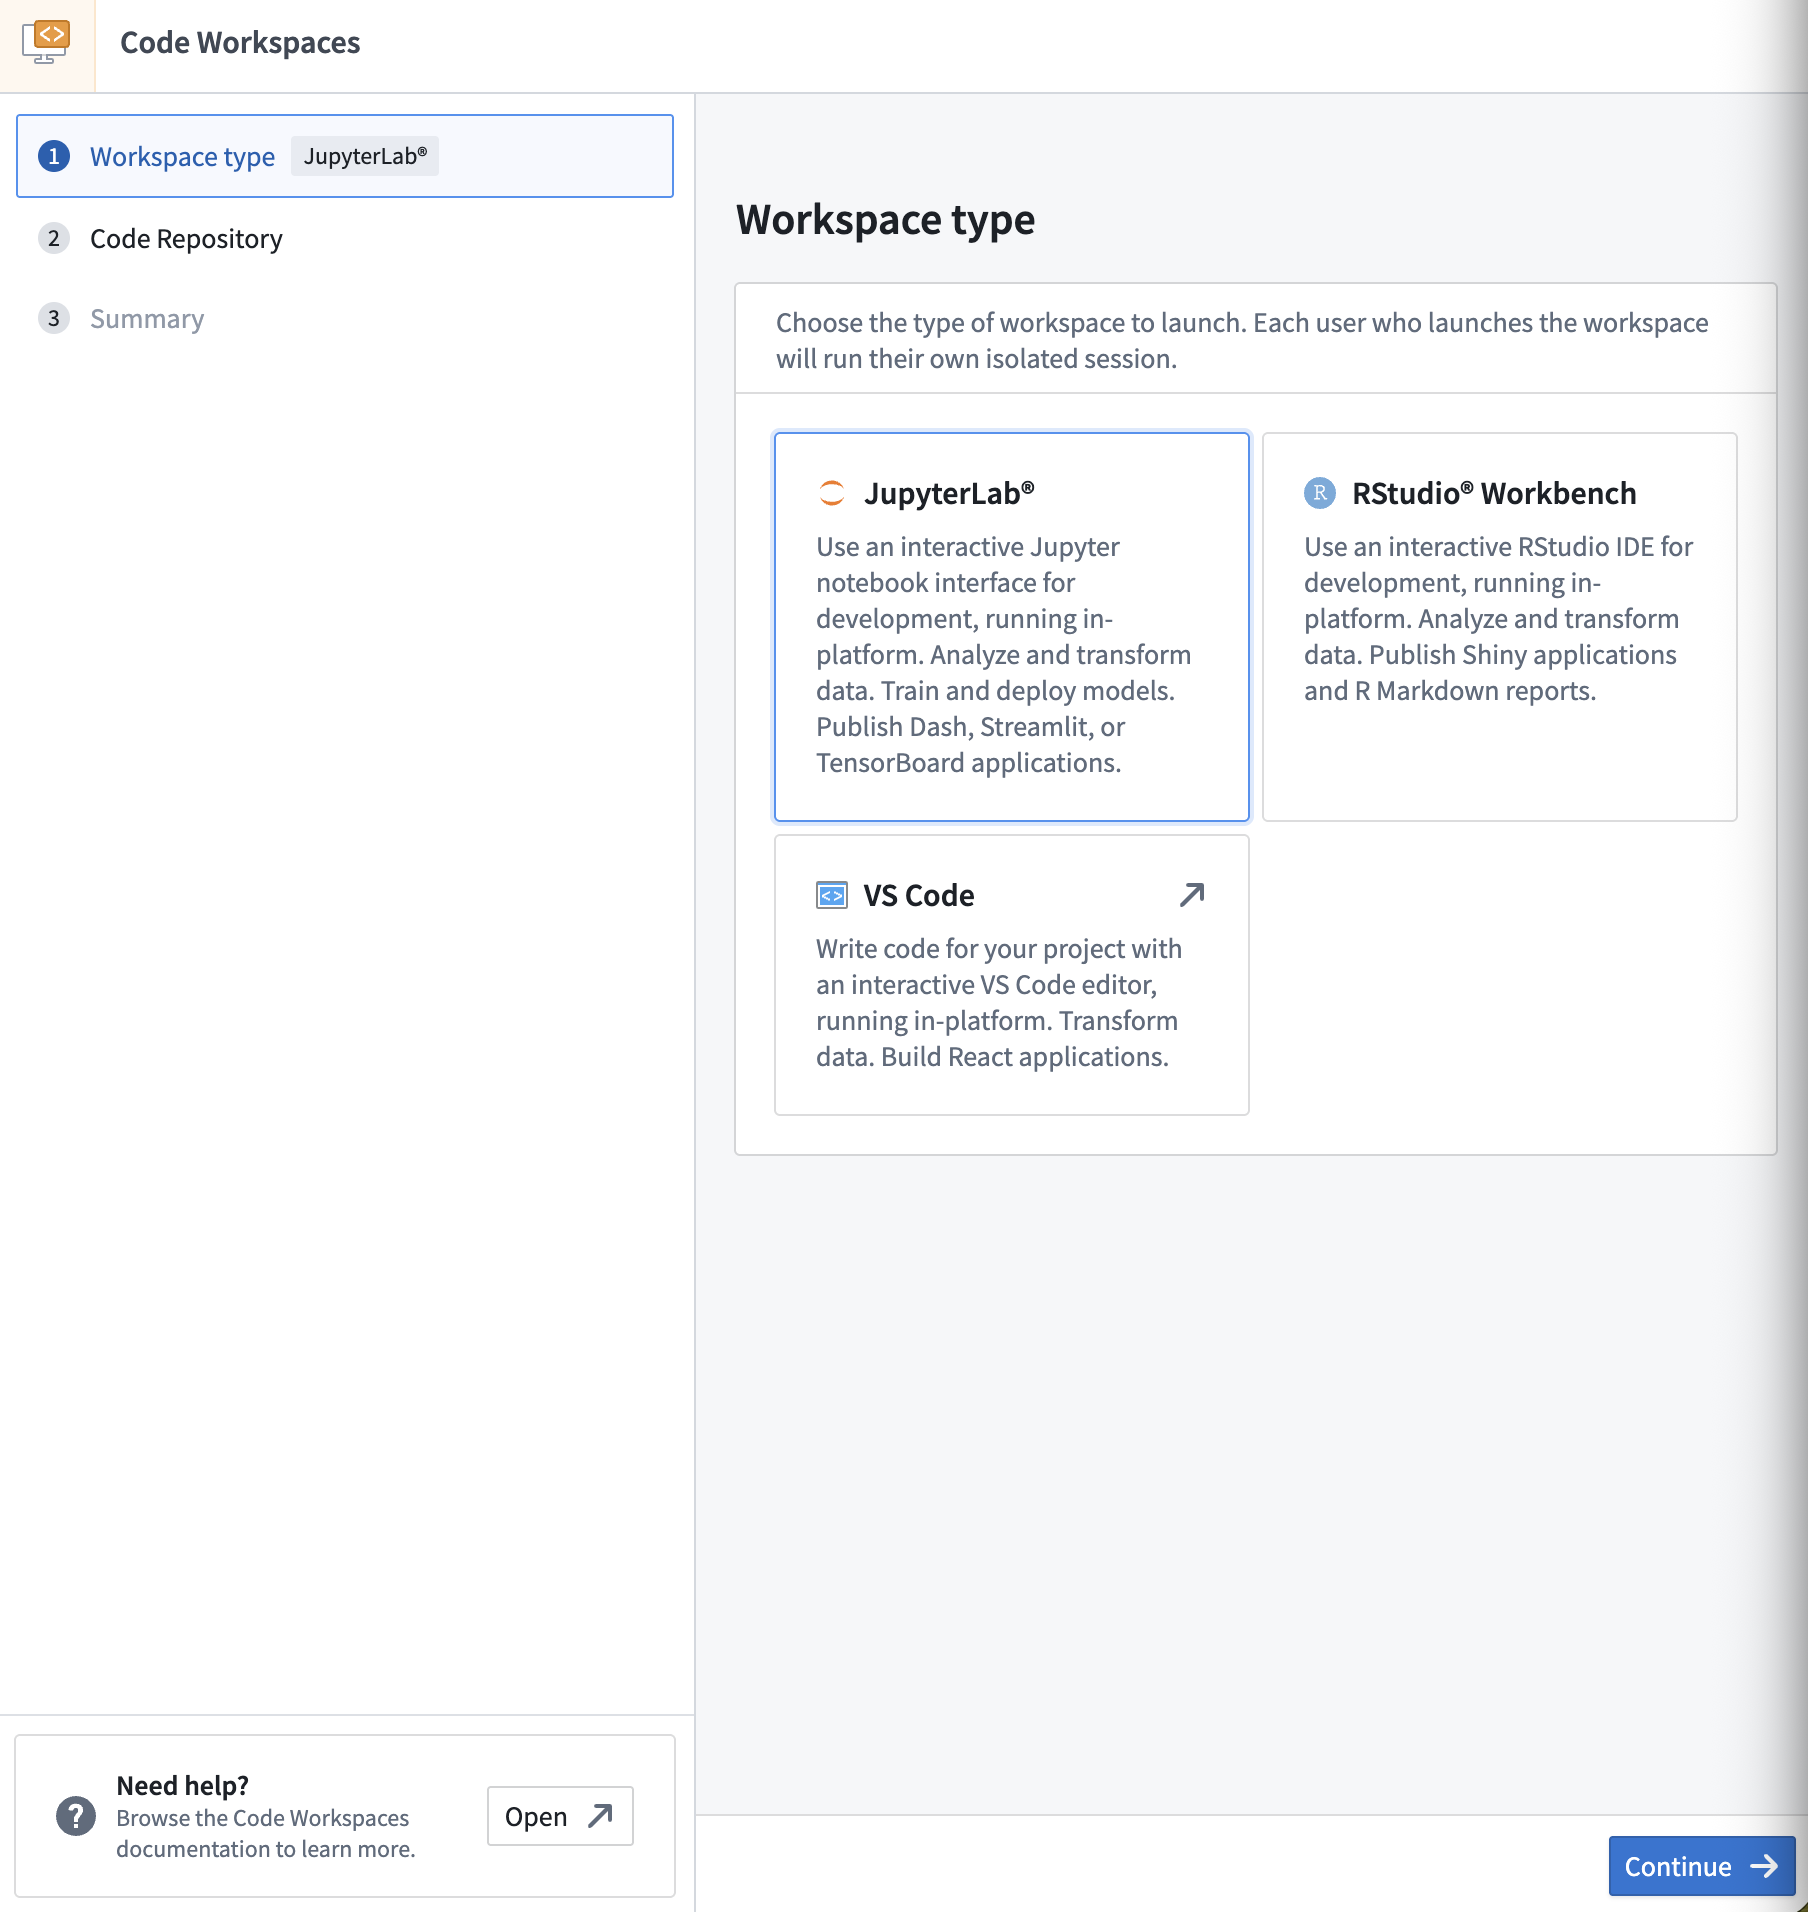
3) Select JupyterLab → click Continue.
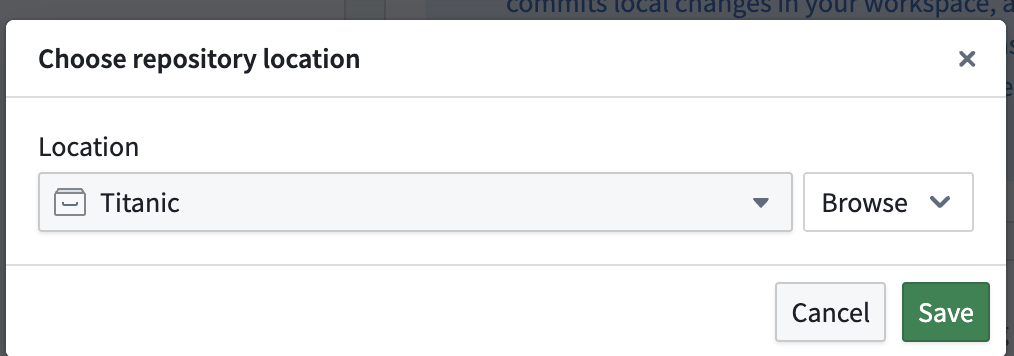
4) In Select location, choose the project Titanic → click Continue.
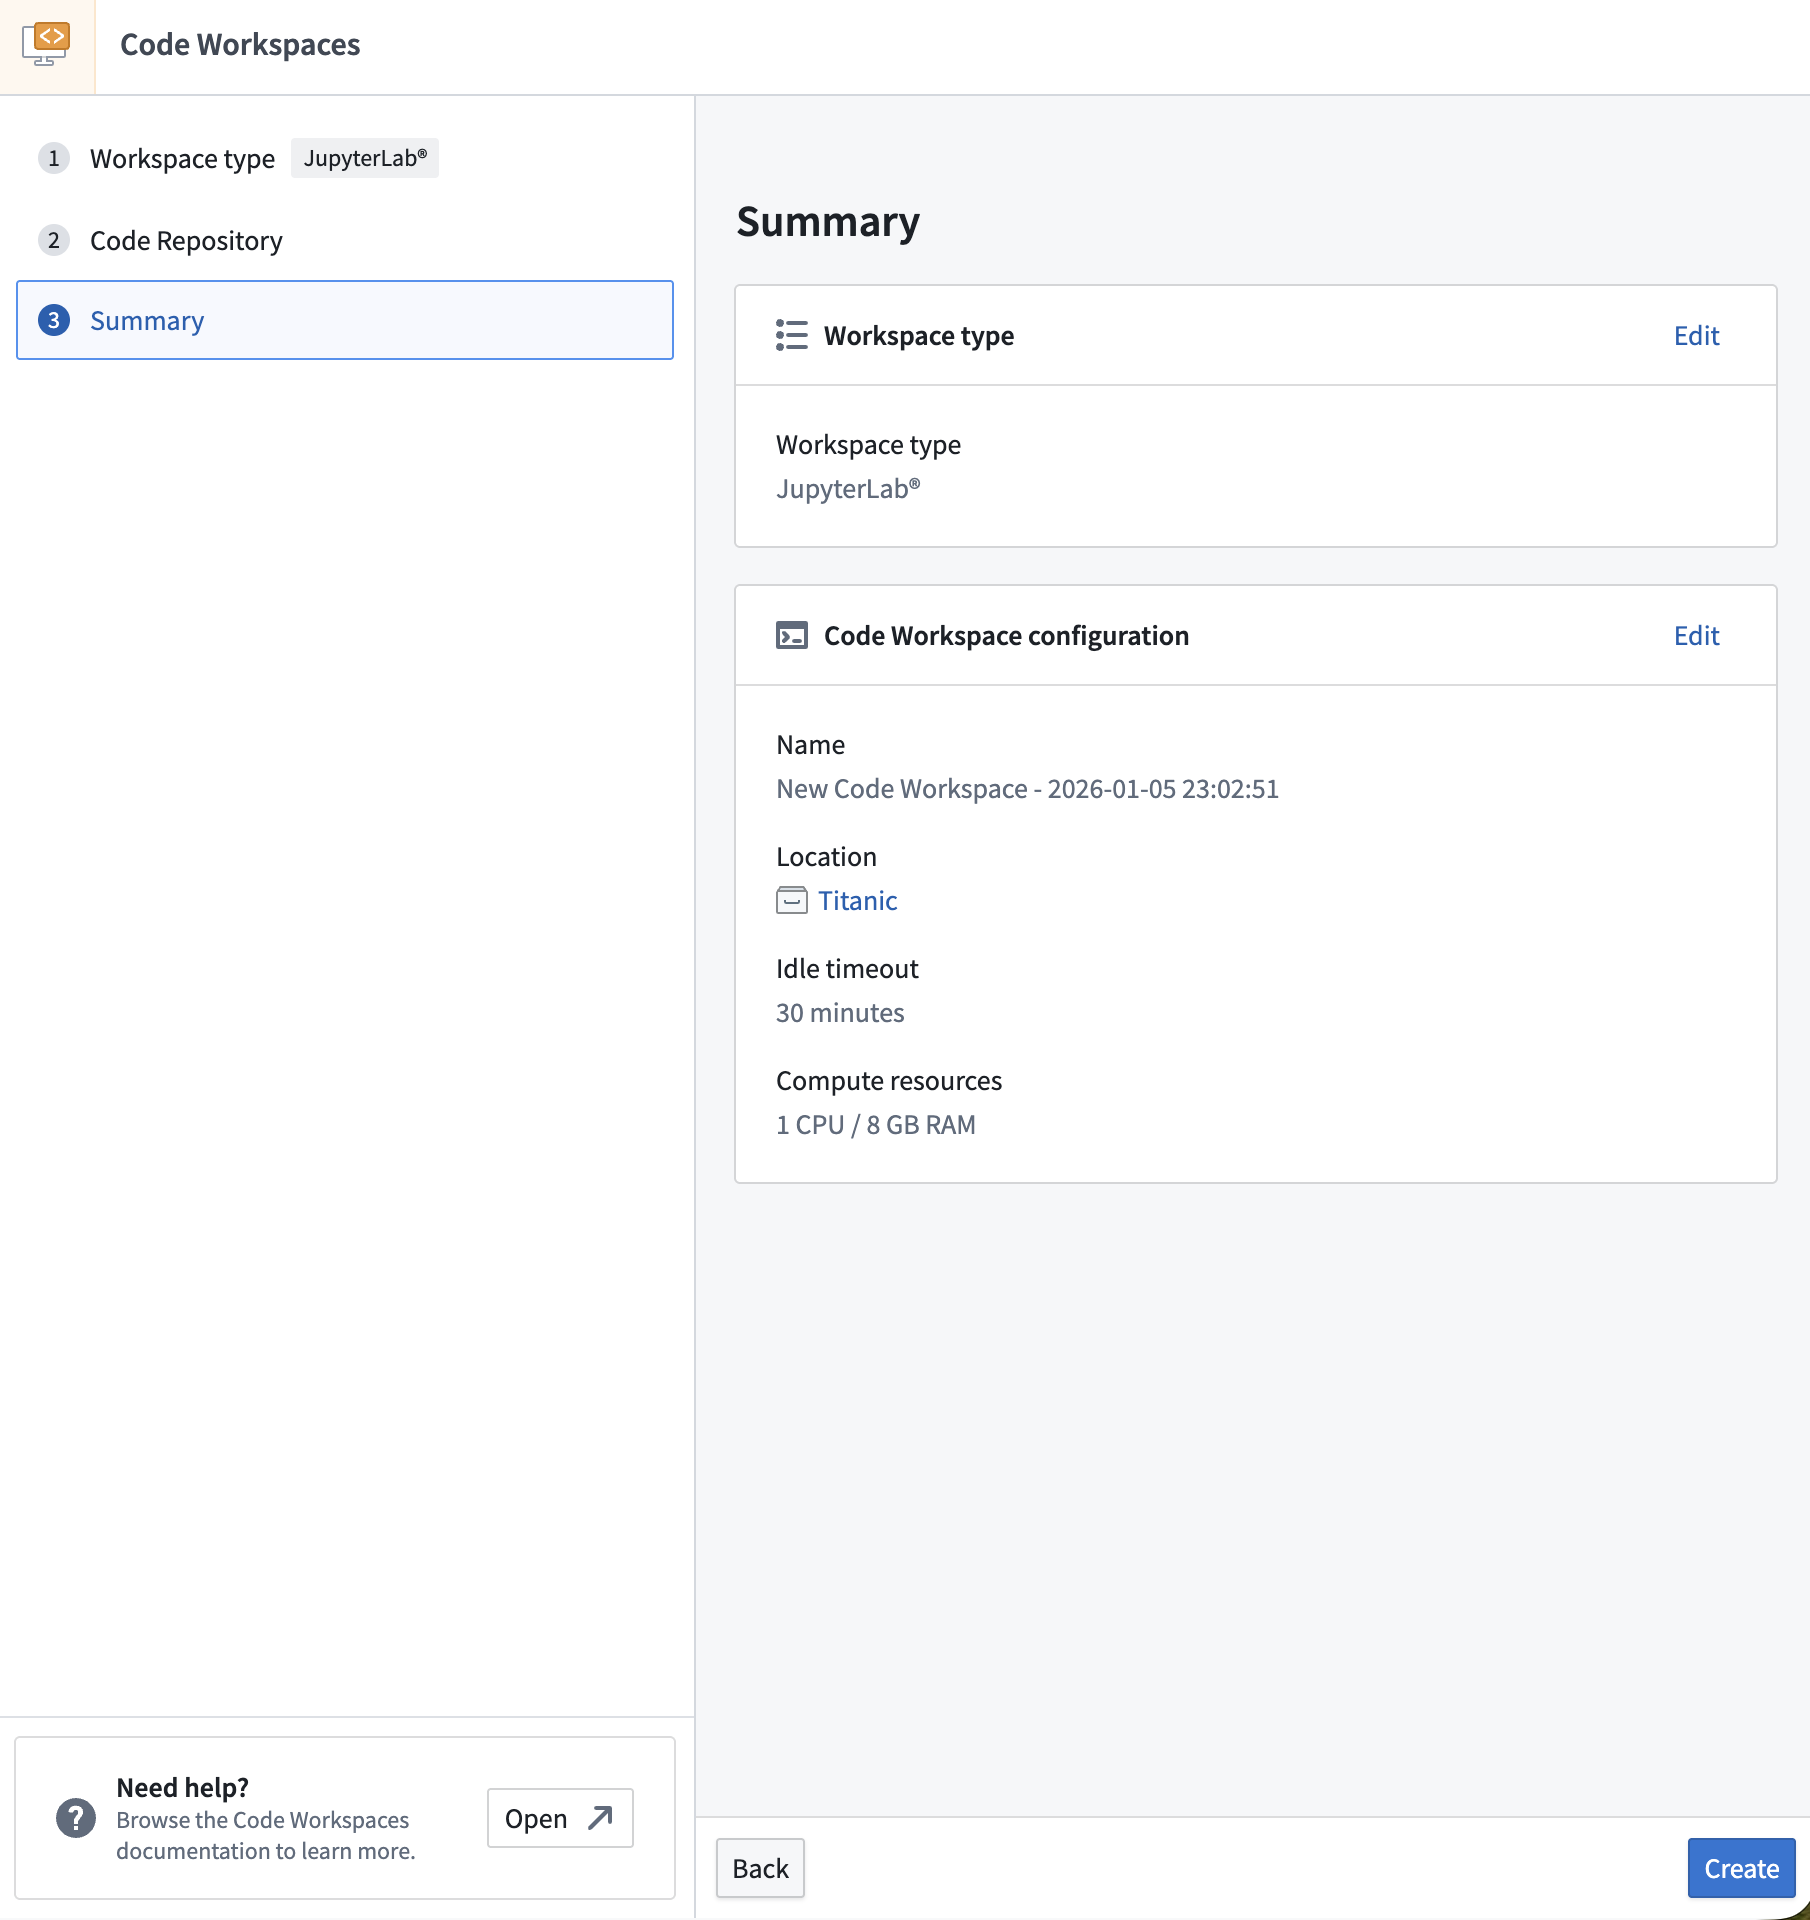
5) Review the summary and click Create.
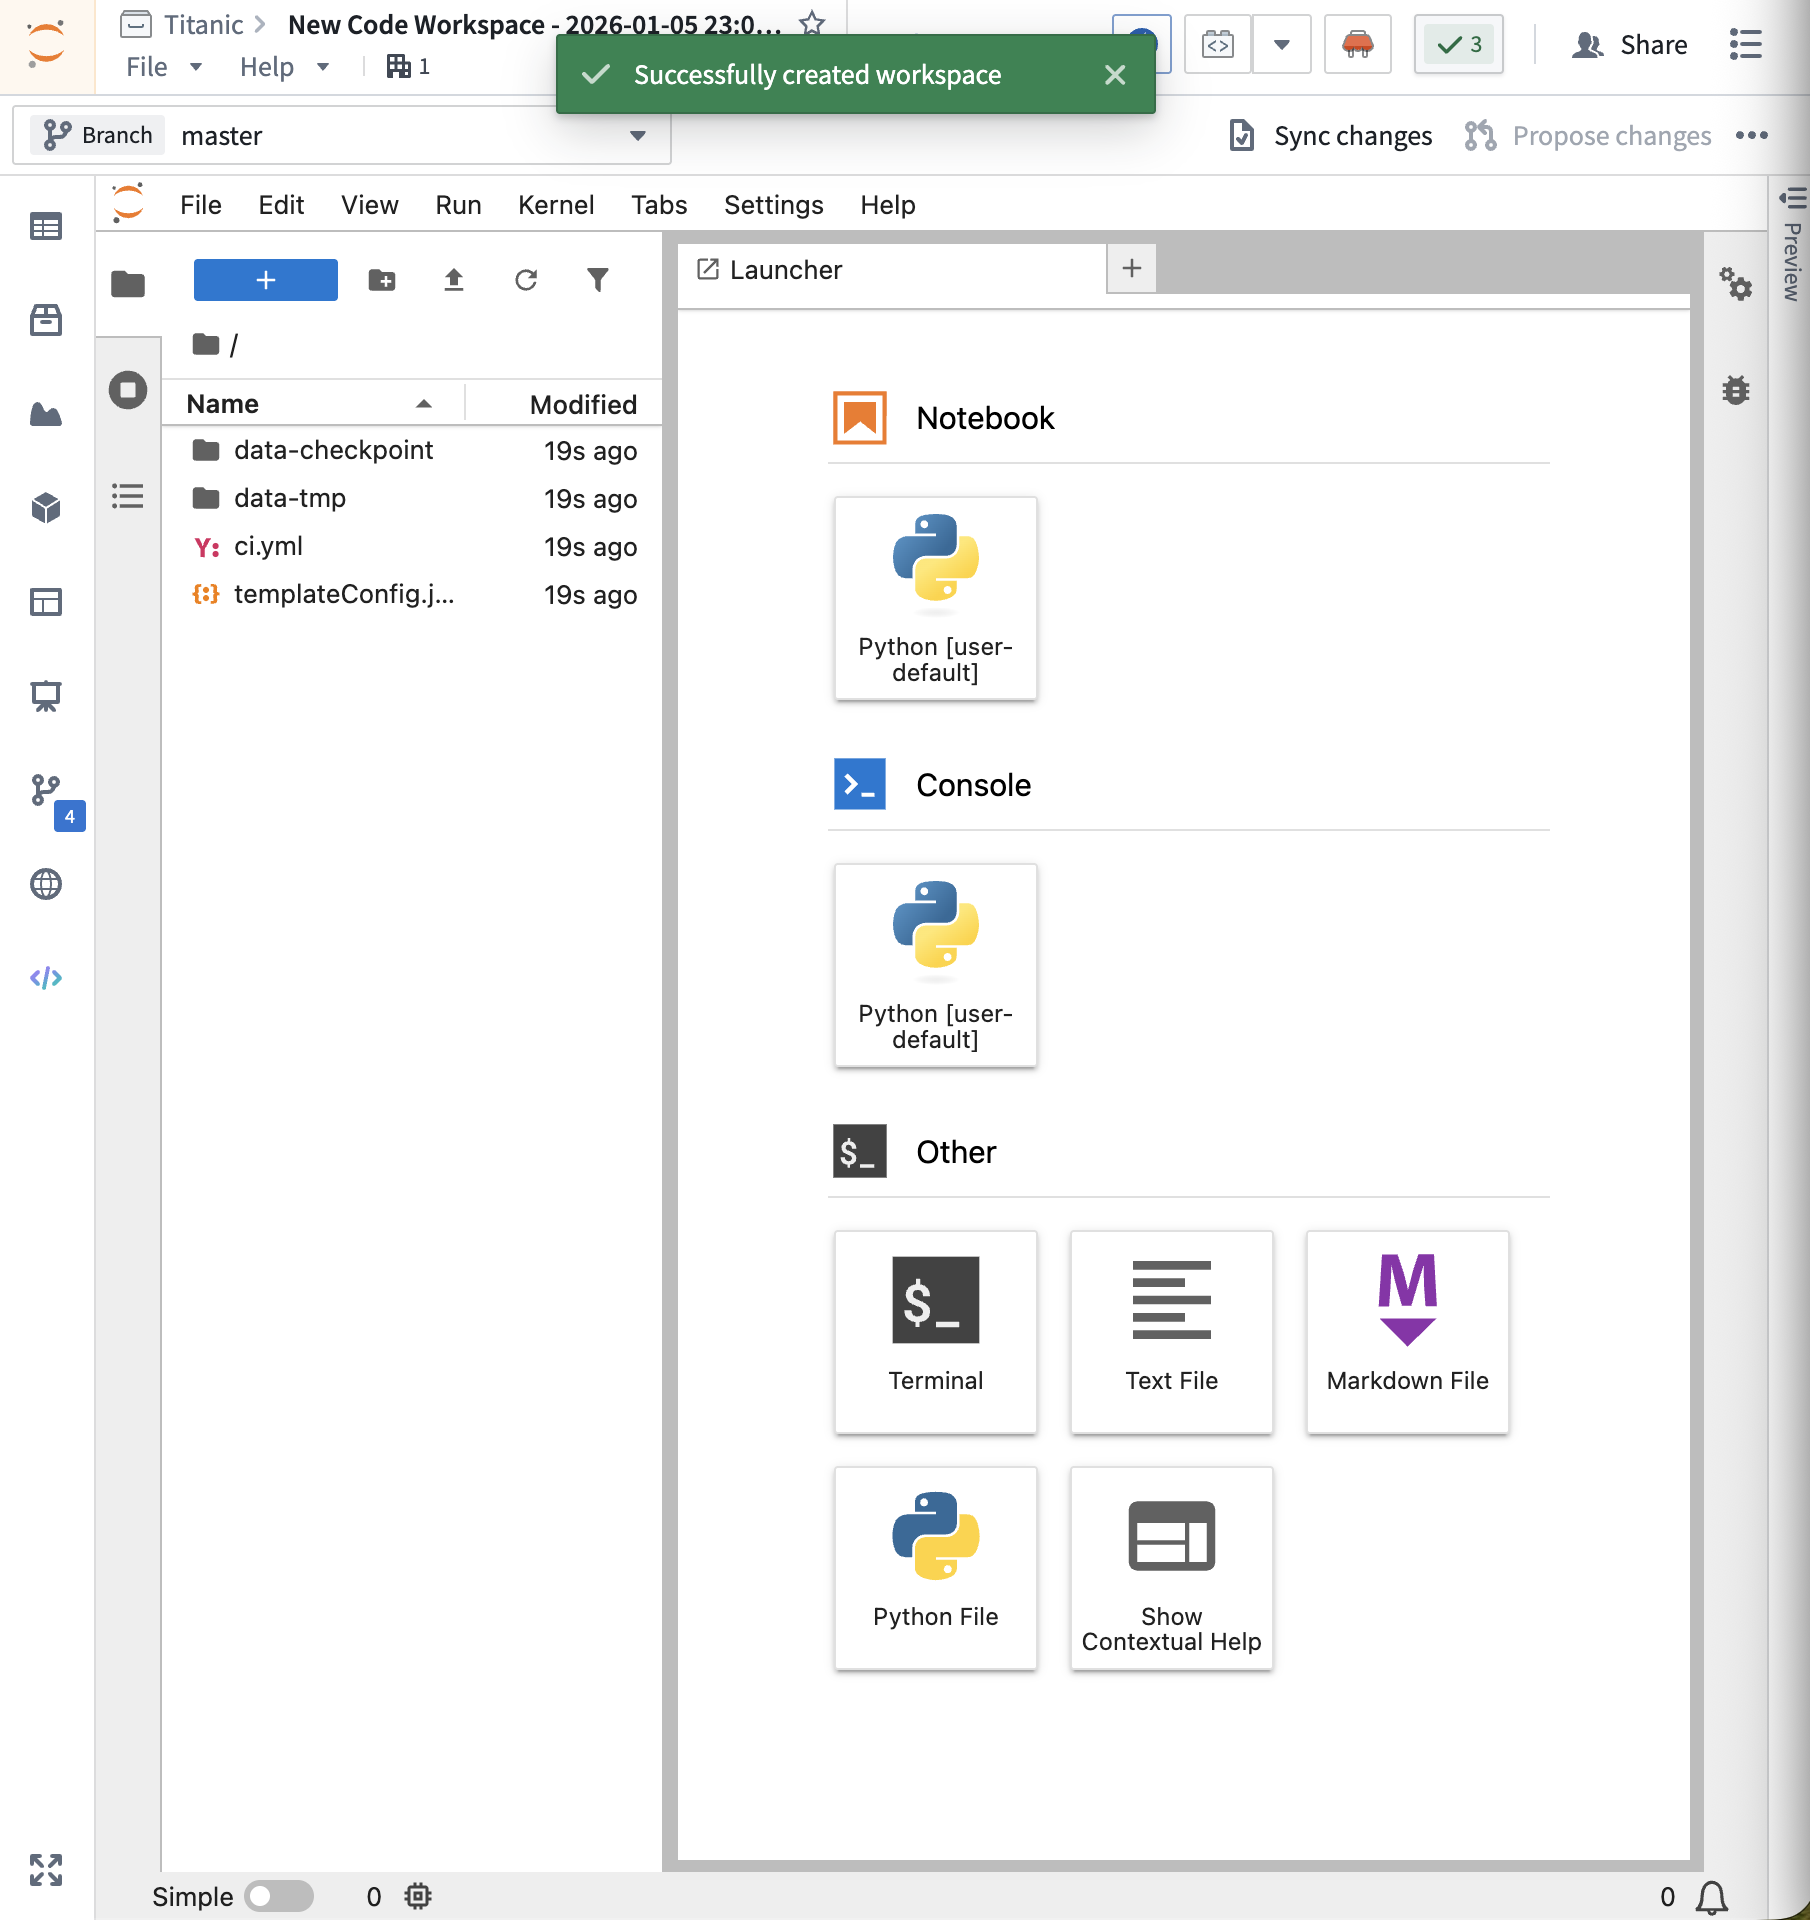
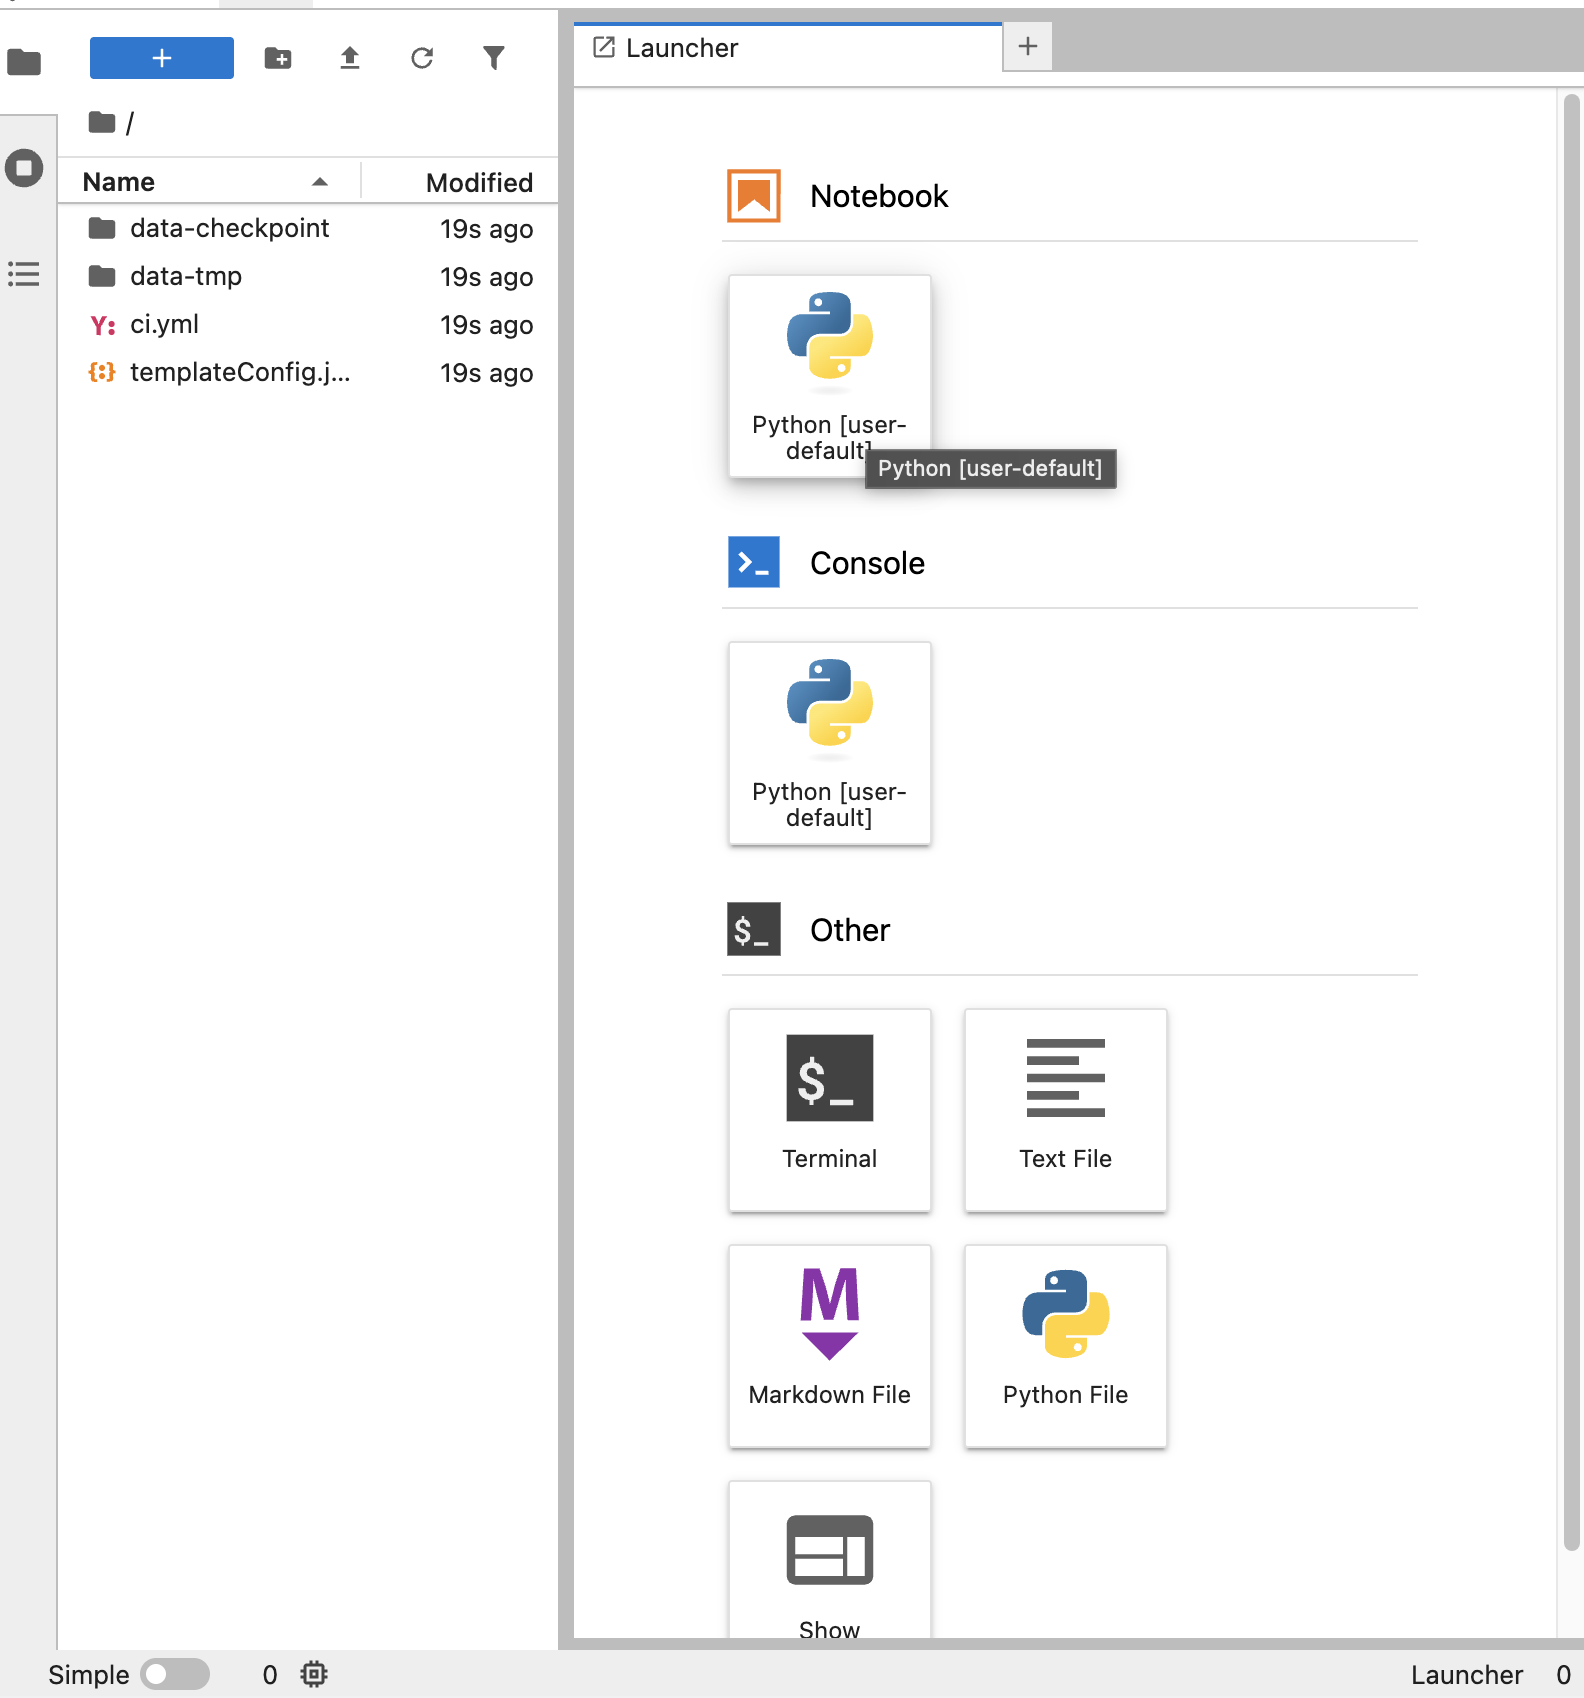
6) After a short wait, you should see a page like this.
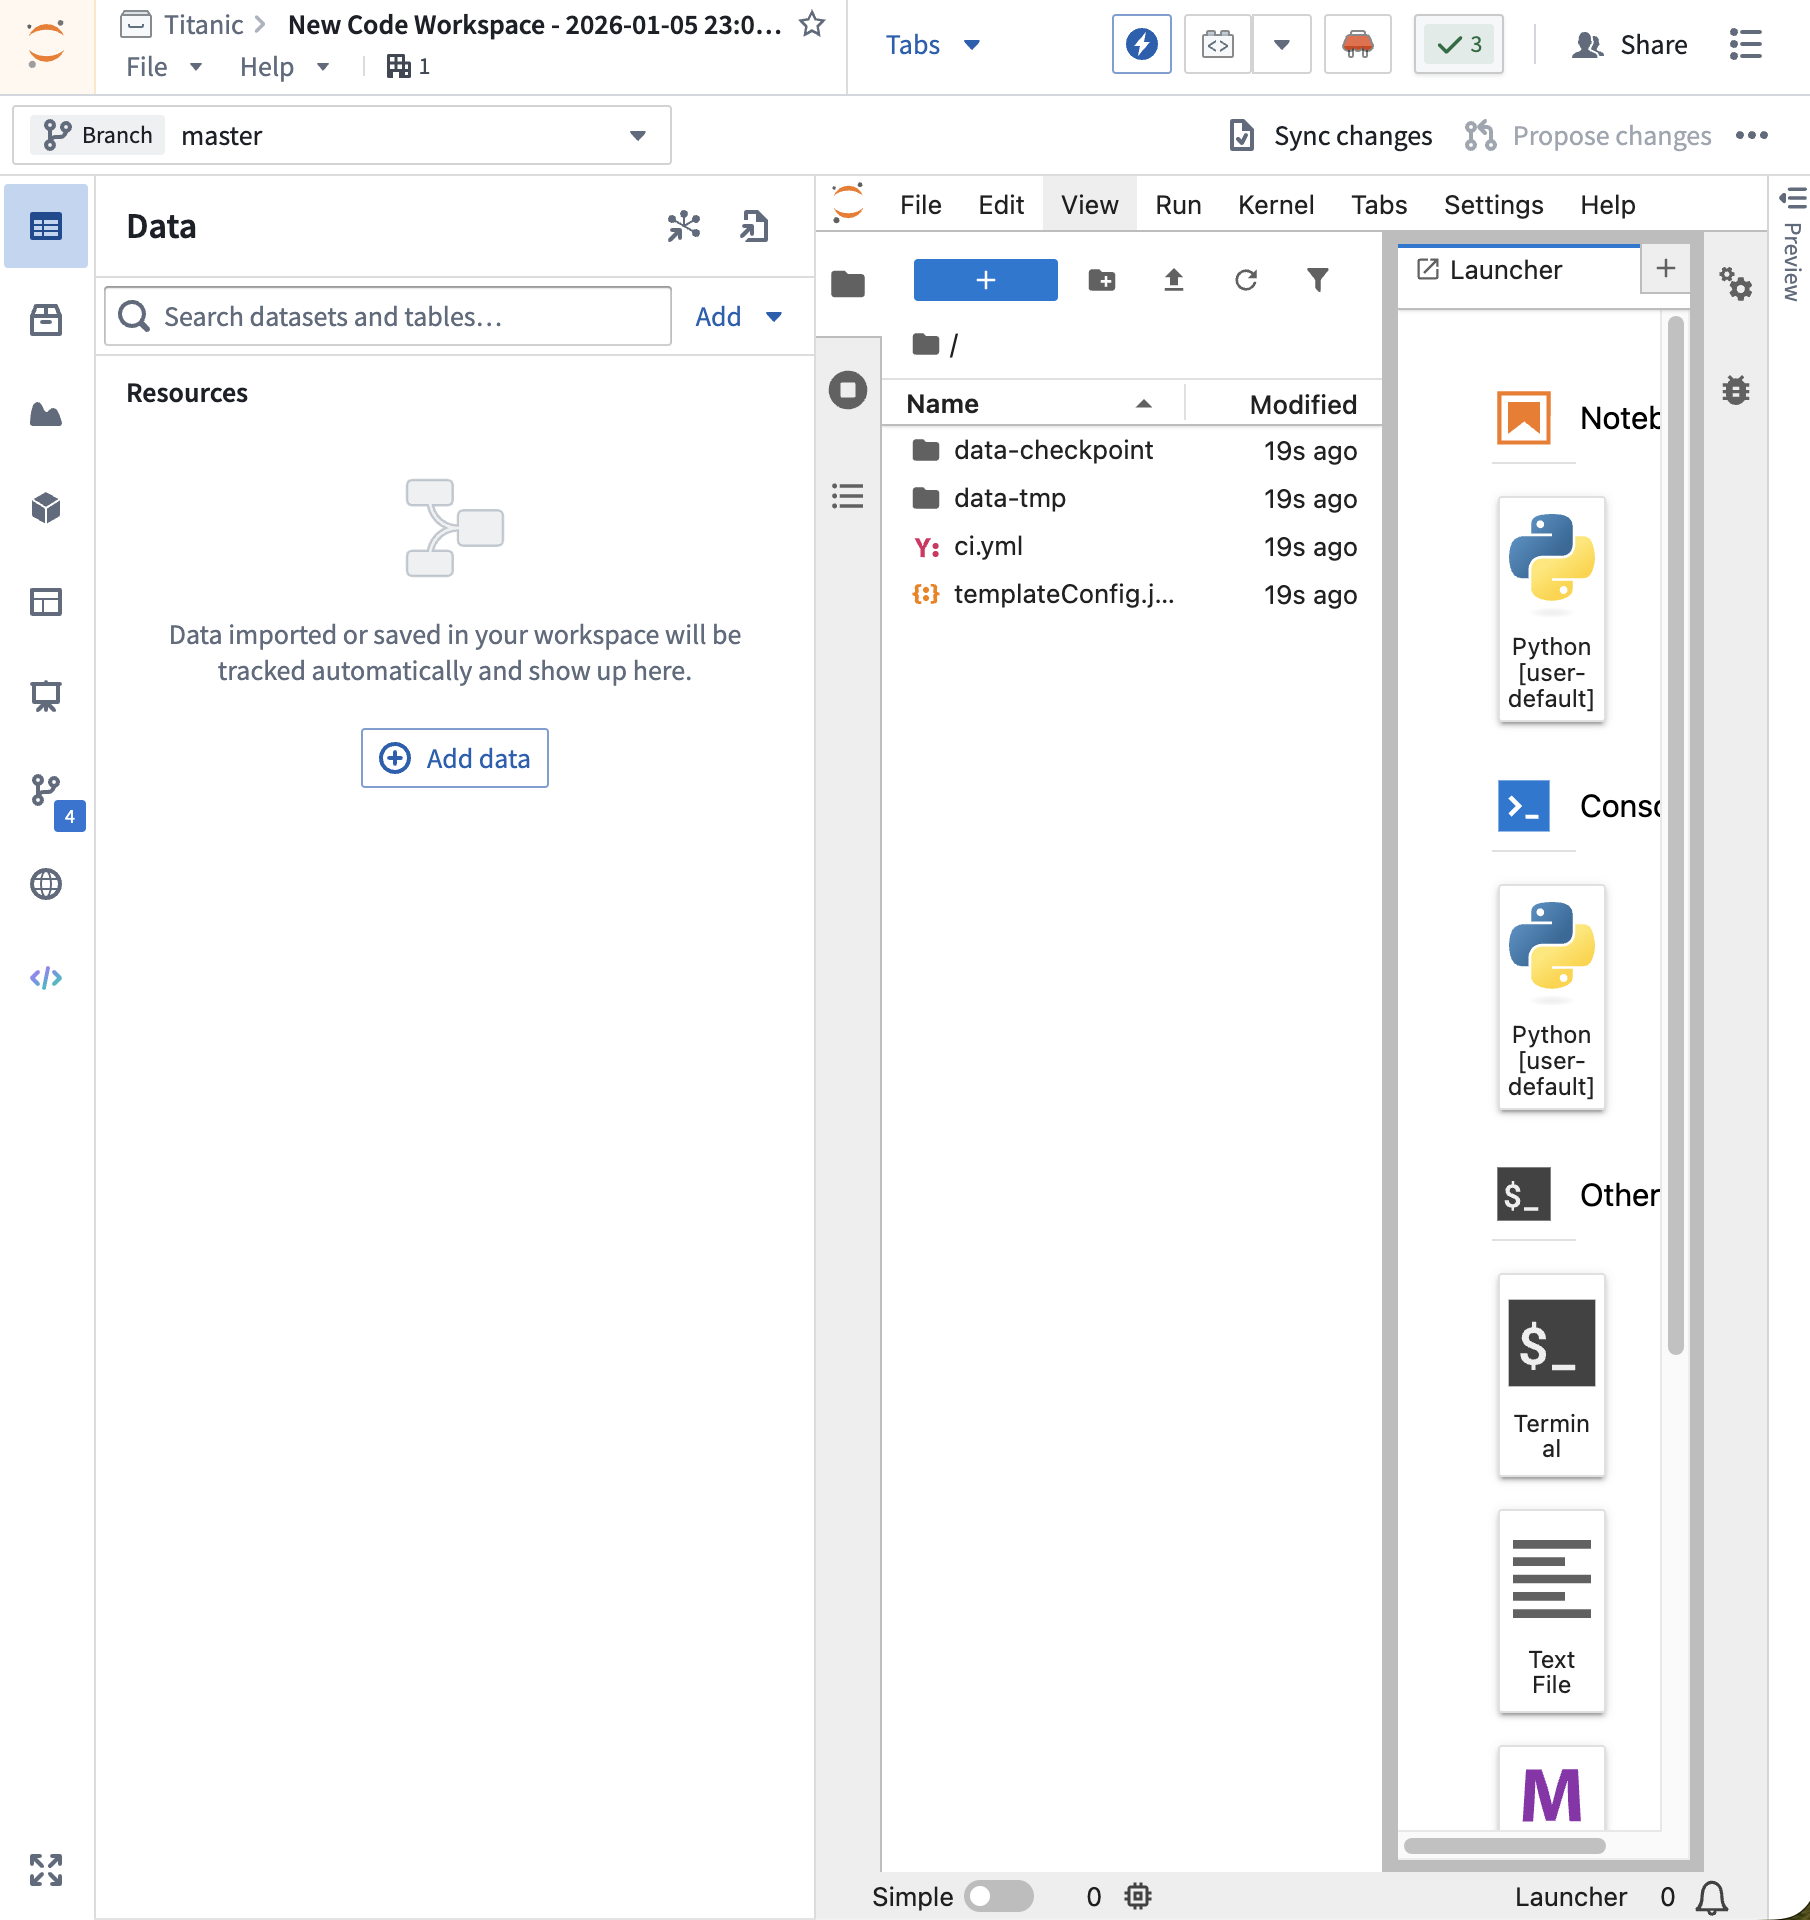
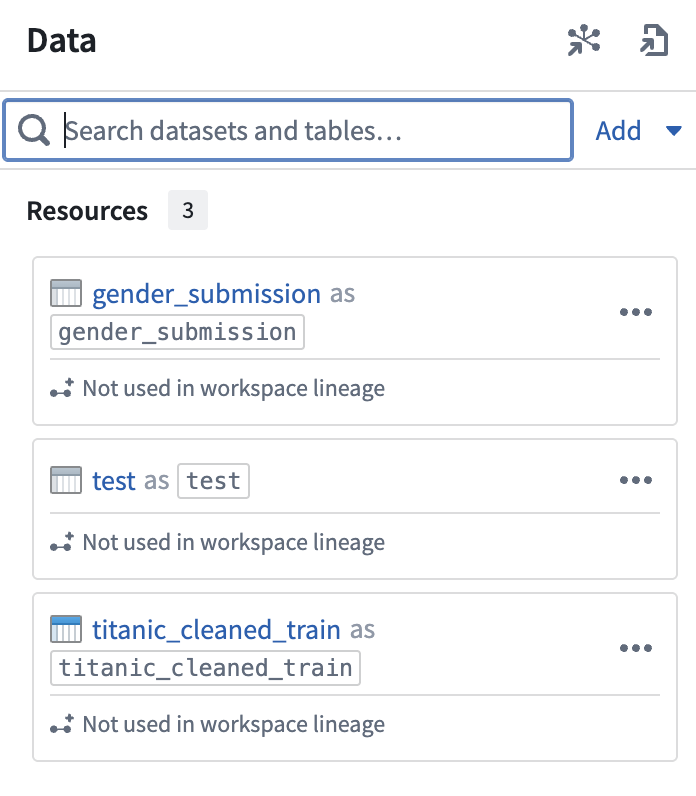
7) Open the Data panel → click Add Data and load the datasets you created.

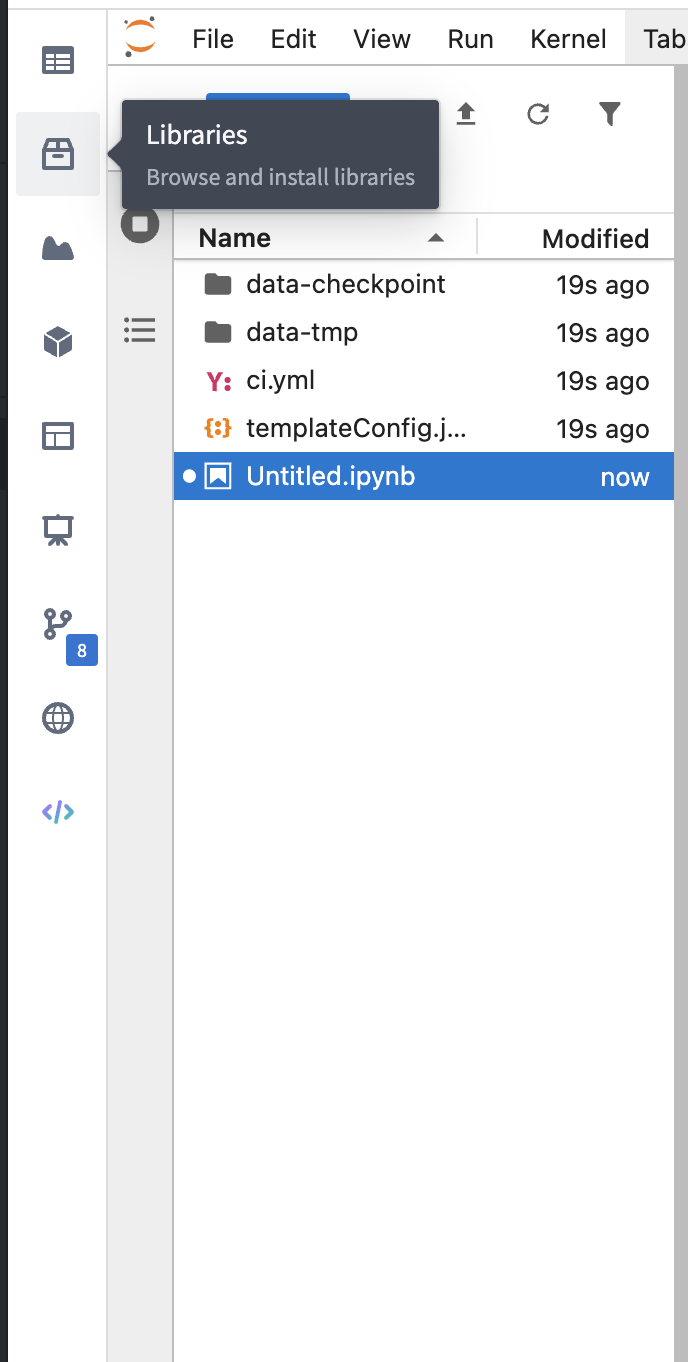
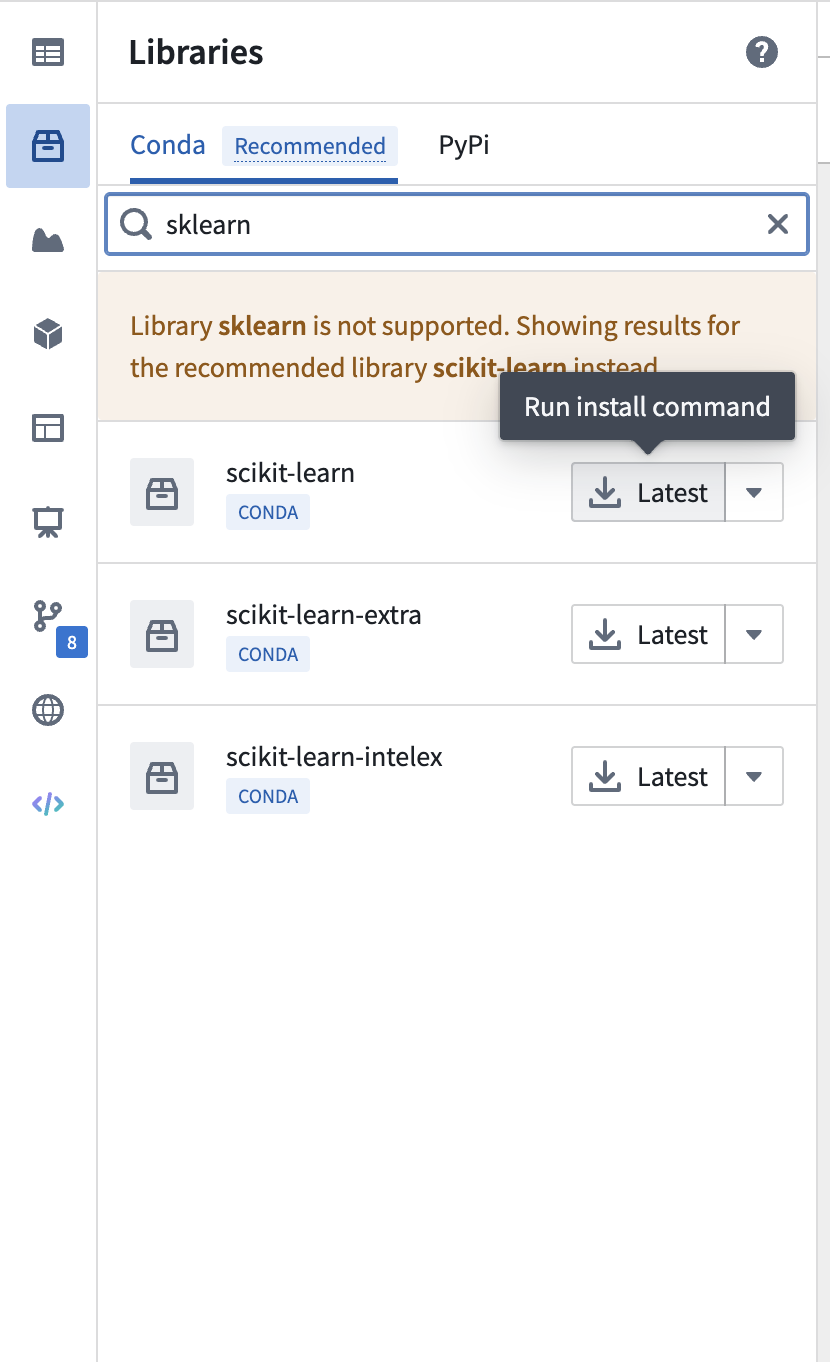
8) Create a new Python environment for the notebook and install scikit-learn from the library.
2. Load data & train a baseline model (RandomForest)
The following is a baseline setup to quickly validate end-to-end training and prediction.
2.1 Load data
# 1. Load data
from foundry.transforms import Dataset
import pandas as pd
import numpy as np

titanic_cleaned_train = Dataset.get("titanic_cleaned_train").read_table(format="pandas")
test = Dataset.get("test").read_table(format="pandas")

print("✅ Data loading complete!")
print(f"Train data: {titanic_cleaned_train.shape}")
print(f"Test data: {test.shape}")
print("\nColumn list:")
print(titanic_cleaned_train.columns.tolist())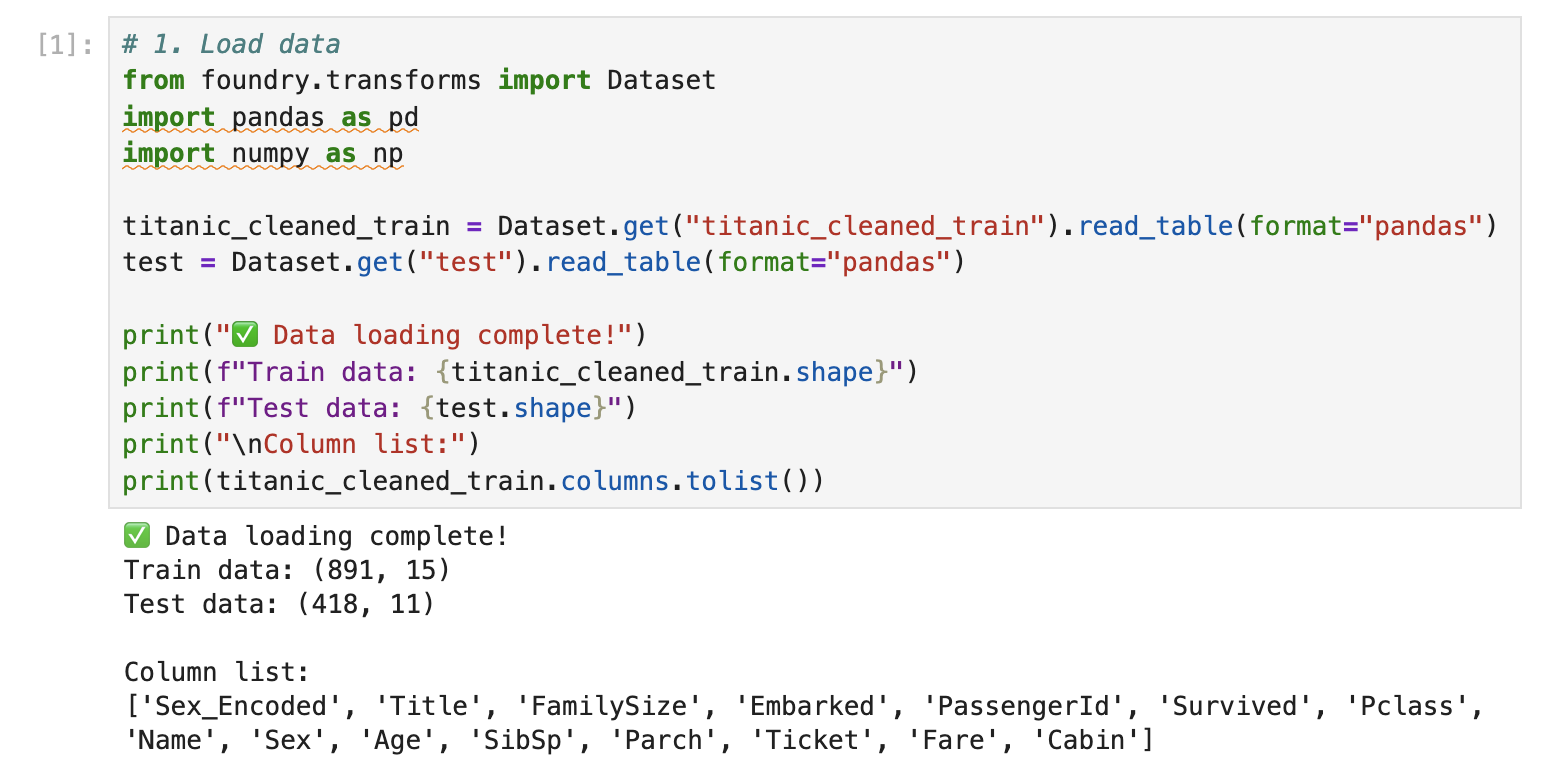
If you see warnings, you can usually ignore them as long as the data loads successfully.
2.2 Preprocess (build training features)
# 2. Data preprocessing and feature preparation

# Add Sex_Encoded to Test data
test["Sex_Encoded"] = test["Sex"].map({"male": 0, "female": 1})

# Missing value handling
test["Age"].fillna(titanic_cleaned_train["Age"].median(), inplace=True)
test["Fare"].fillna(test["Fare"].median(), inplace=True)

# Select features to use for learning
features = ["Pclass", "Sex_Encoded", "Age", "SibSp", "Parch", "Fare"]

# X, y separation
X_train = titanic_cleaned_train[features]
y_train = titanic_cleaned_train["Survived"]
X_test = test[features]

print("✅ Preprocessing completed!")
print(f"\nX_train shape: {X_train.shape}")
print(f"y_train shape: {y_train.shape}")
print(f"X_test shape: {X_test.shape}")
print(f"\nCheck for missing values:")
print(f"Train: {X_train.isnull().sum().sum()}")
print(f"Test: {X_test.isnull().sum().sum()}")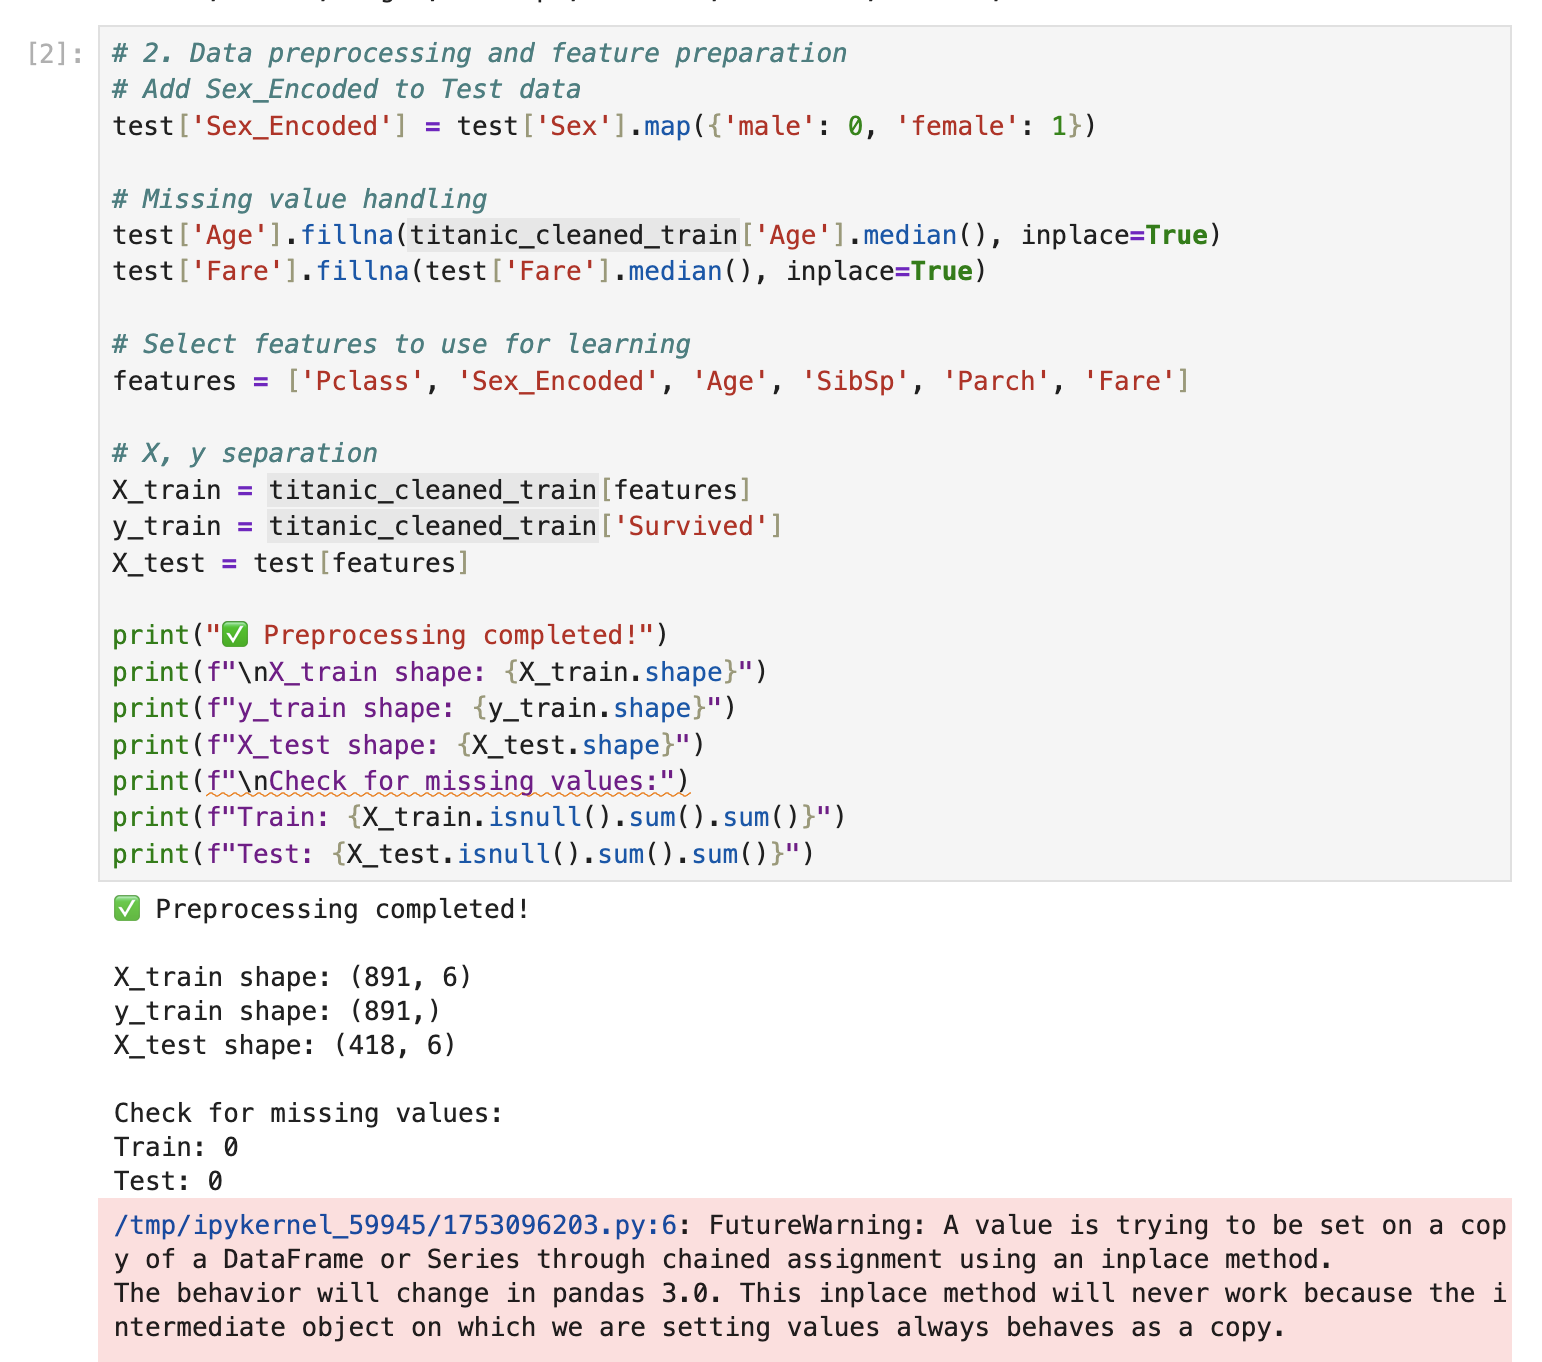
2.3 Train a model (RandomForest) + cross validation
# 3. Random forest model training
from sklearn.ensemble import RandomForestClassifier
from sklearn.model_selection import cross_val_score

rf_model = RandomForestClassifier(
    n_estimators=100,
    max_depth=10,
    min_samples_split=5,
    min_samples_leaf=2,
    random_state=42,
)

print("🚀 Training the model...")
rf_model.fit(X_train, y_train)

cv_scores = cross_val_score(rf_model, X_train, y_train, cv=5, scoring="accuracy")

print("✅ Model training complete!")
print("\n📊 Cross-Validation Accuracy:")
print(f"   average: {cv_scores.mean():.4f}")
print(f"   standard deviation: {cv_scores.std():.4f}")
print(f"   Each Fold: {[f'{score:.4f}' for score in cv_scores]}")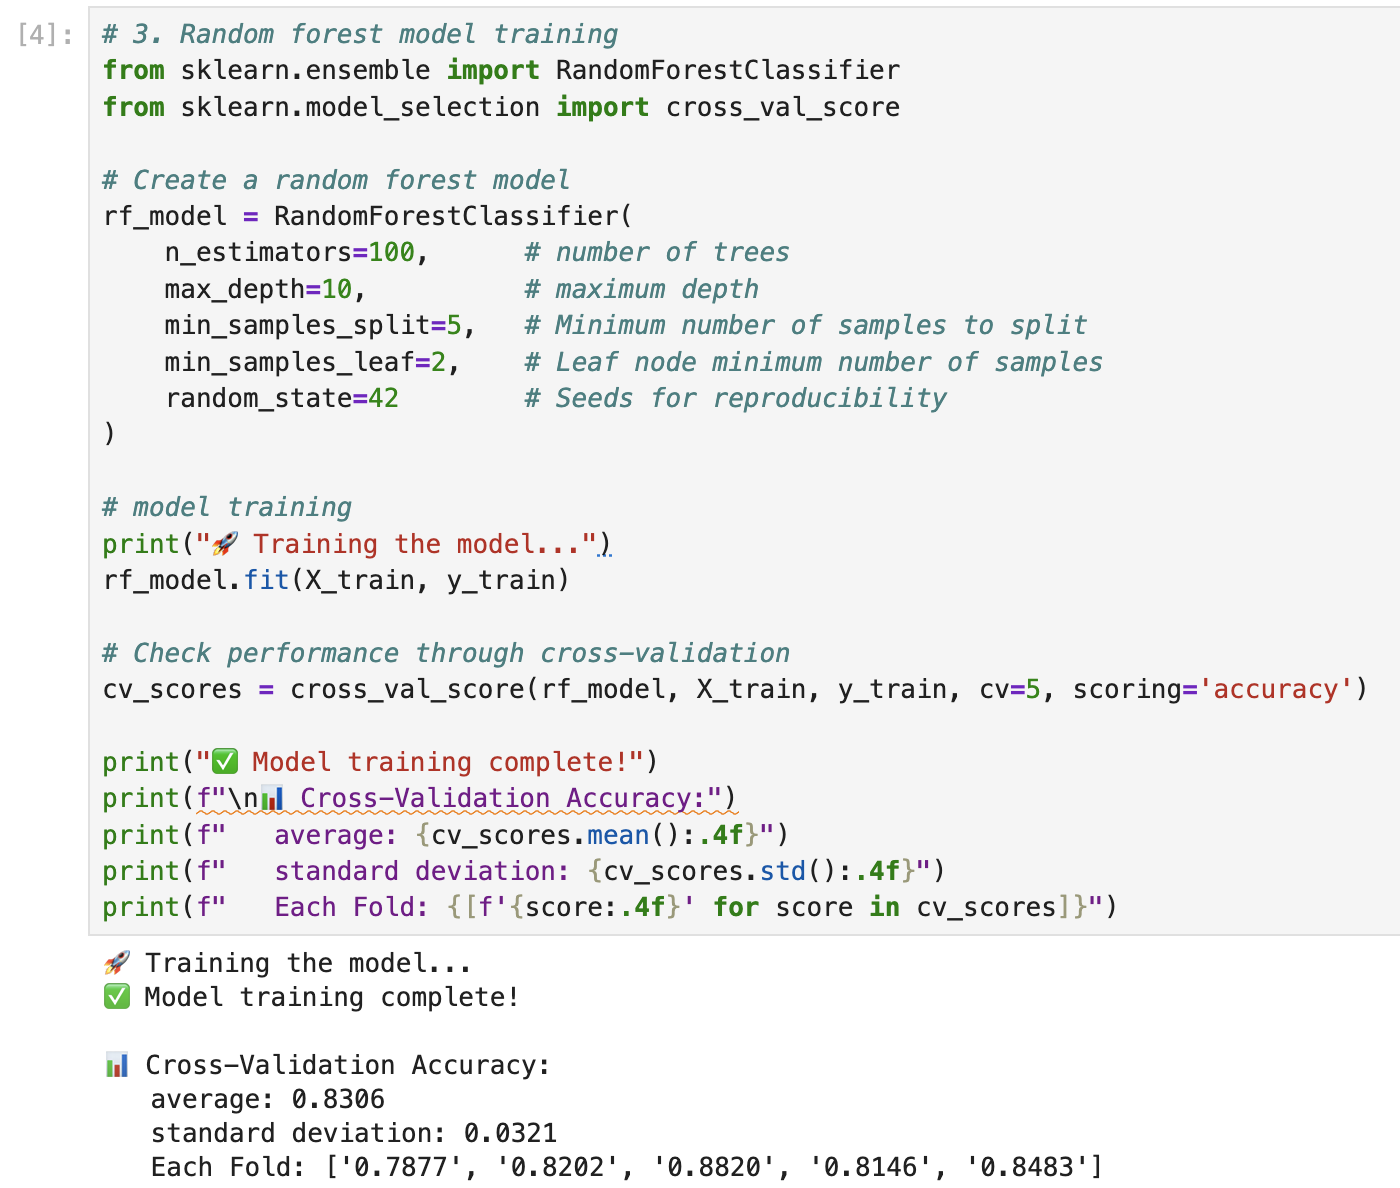
2.4 Check feature importance
# 4. Check Feature Importance
feature_importance = pd.DataFrame(
    {"feature": features, "importance": rf_model.feature_importances_}
).sort_values("importance", ascending=False)

print("📊 Feature Importance:")
print(feature_importance.to_string(index=False))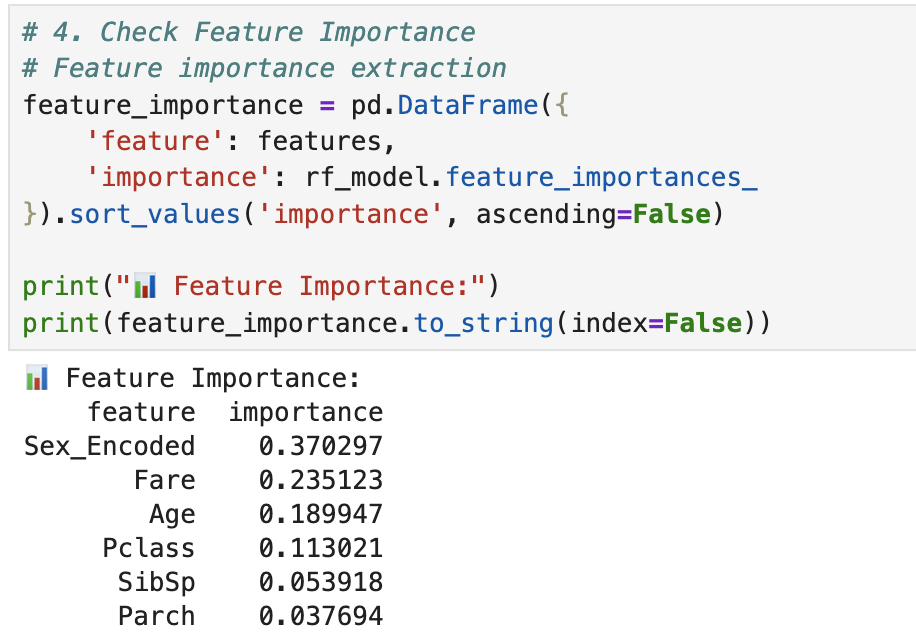
3. Export predictions & submit to Kaggle
3.1 Run predictions
# 5. perform predictions
predictions = rf_model.predict(X_test)
prediction_proba = rf_model.predict_proba(X_test)

print("✅ prediction complete!")
print("\nSummary of prediction results:")
print(f"  - Total number of predictions: {len(predictions)}")
print(f"  - survival prediction: {sum(predictions == 1)}")
print(f"  - death prediction: {sum(predictions == 0)}")
print(f"  - survival rate: {sum(predictions == 1) / len(predictions) * 100:.2f}%")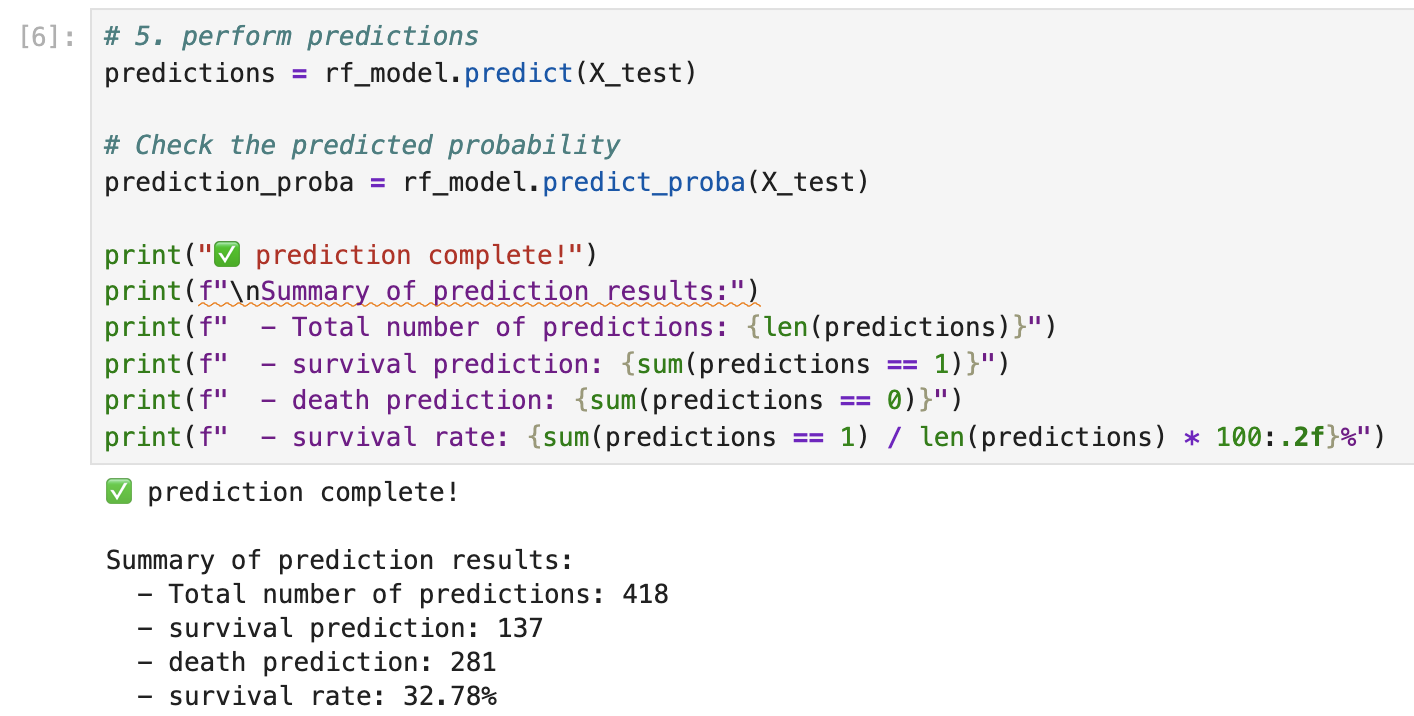
3.2 Create the submission dataframe
# 6. Create a result dataframe
result_df = pd.DataFrame(
    {
        "PassengerId": test["PassengerId"],
        "Survived": predictions,
    }
)

print("📋 Sample prediction results (first 10):")
print(result_df.head(10))

print("\n📋 Sample prediction results (last 10):")
print(result_df.tail(10))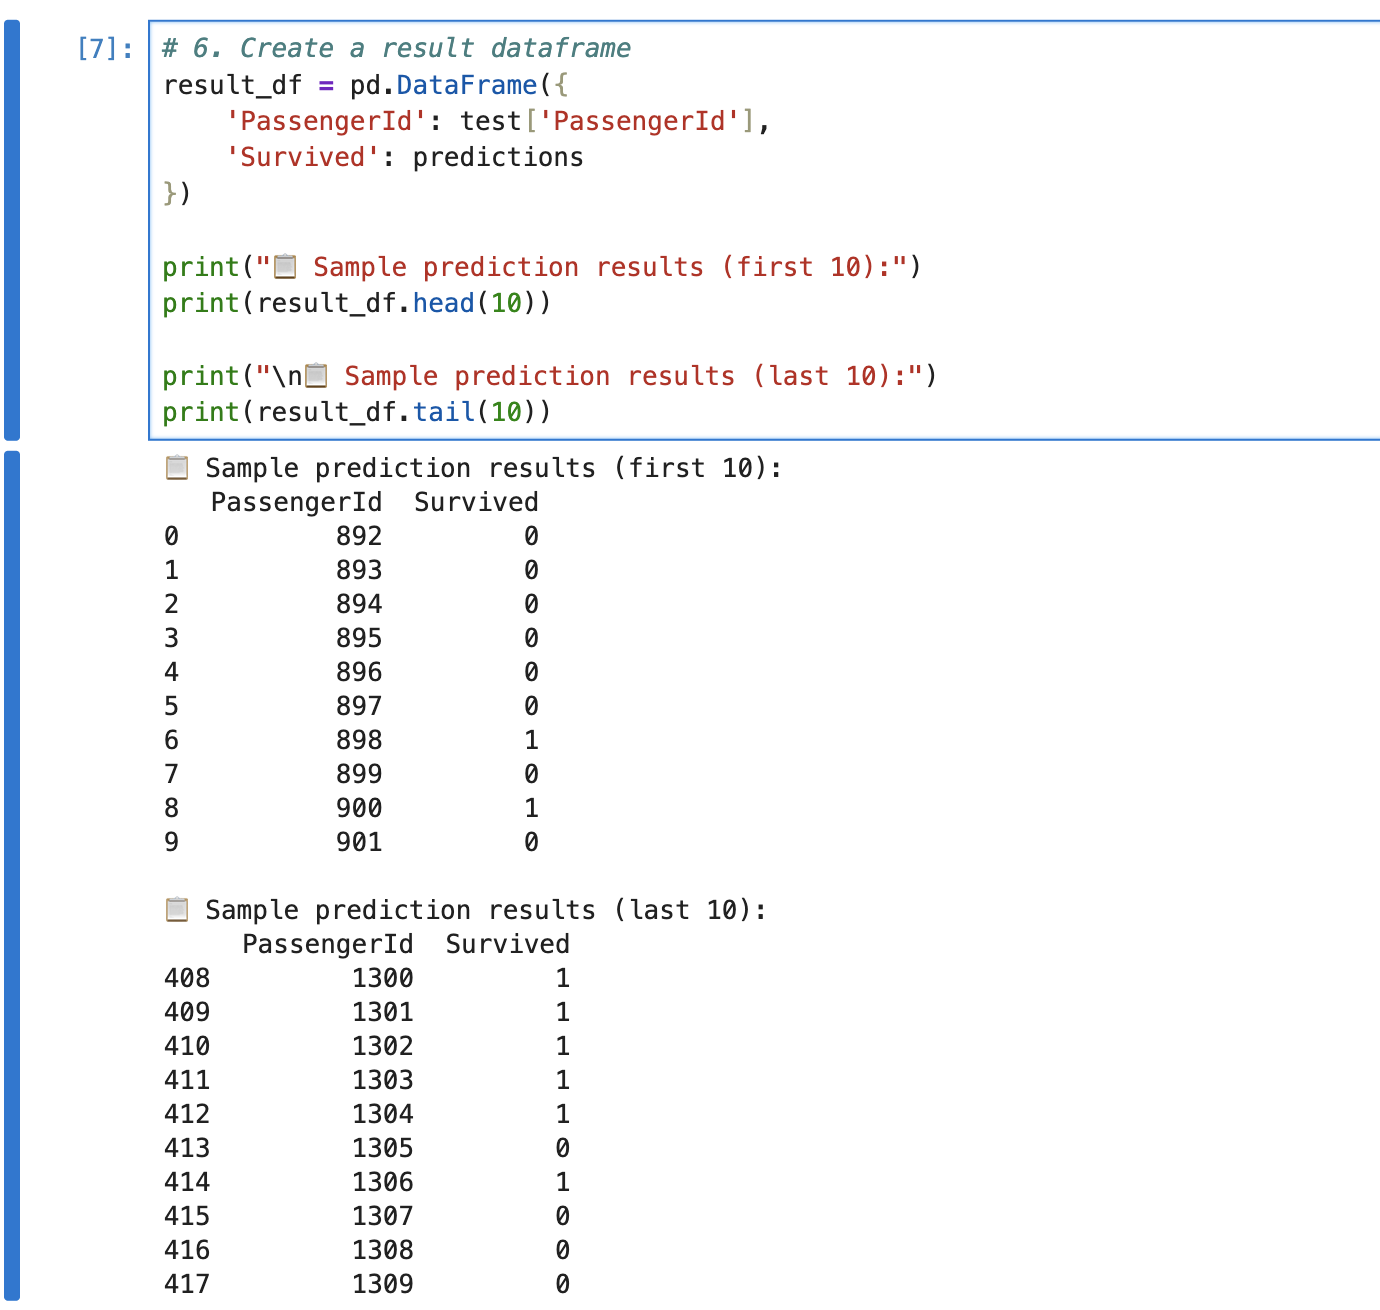
3.3 Write the result back to a Foundry dataset (Export)
# 7. Extract results
gender_submission = Dataset.get("gender_submission")
gender_submission.write_table(result_df)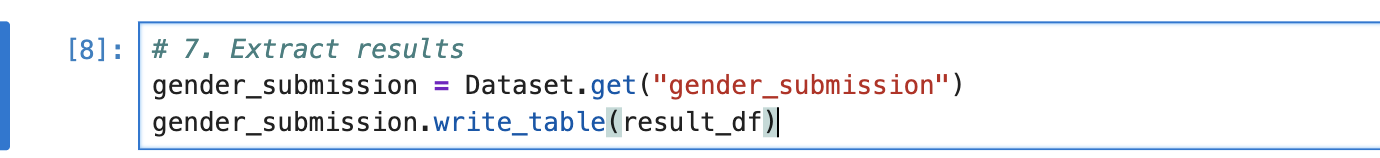
3.4 Submit to Kaggle
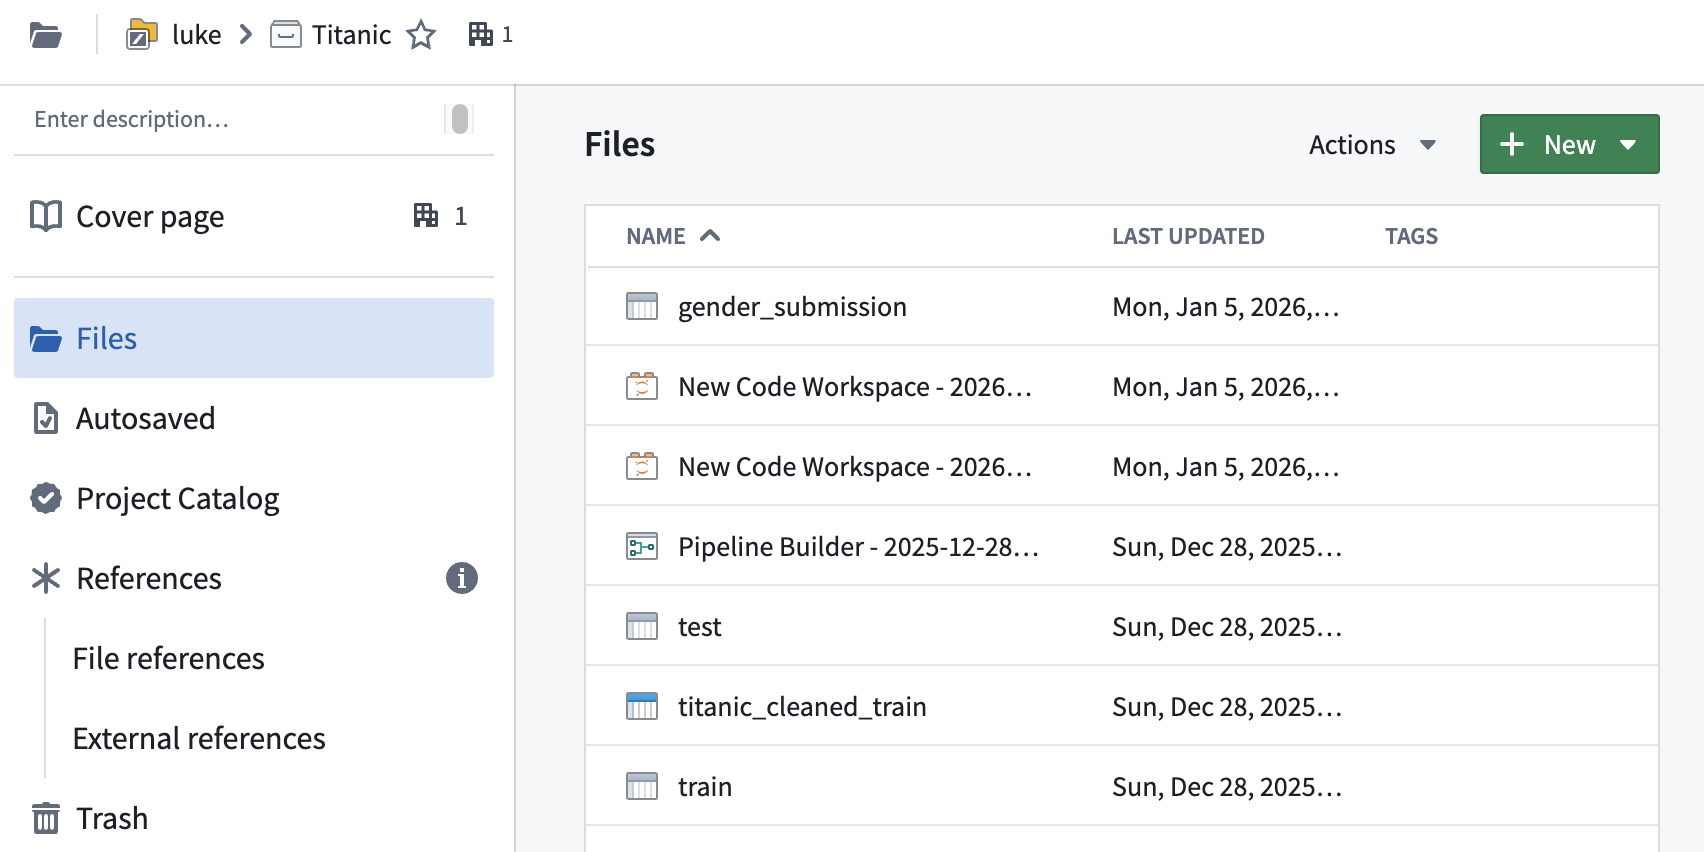
1) Go back to the project home and click the exported gender_submission dataset.
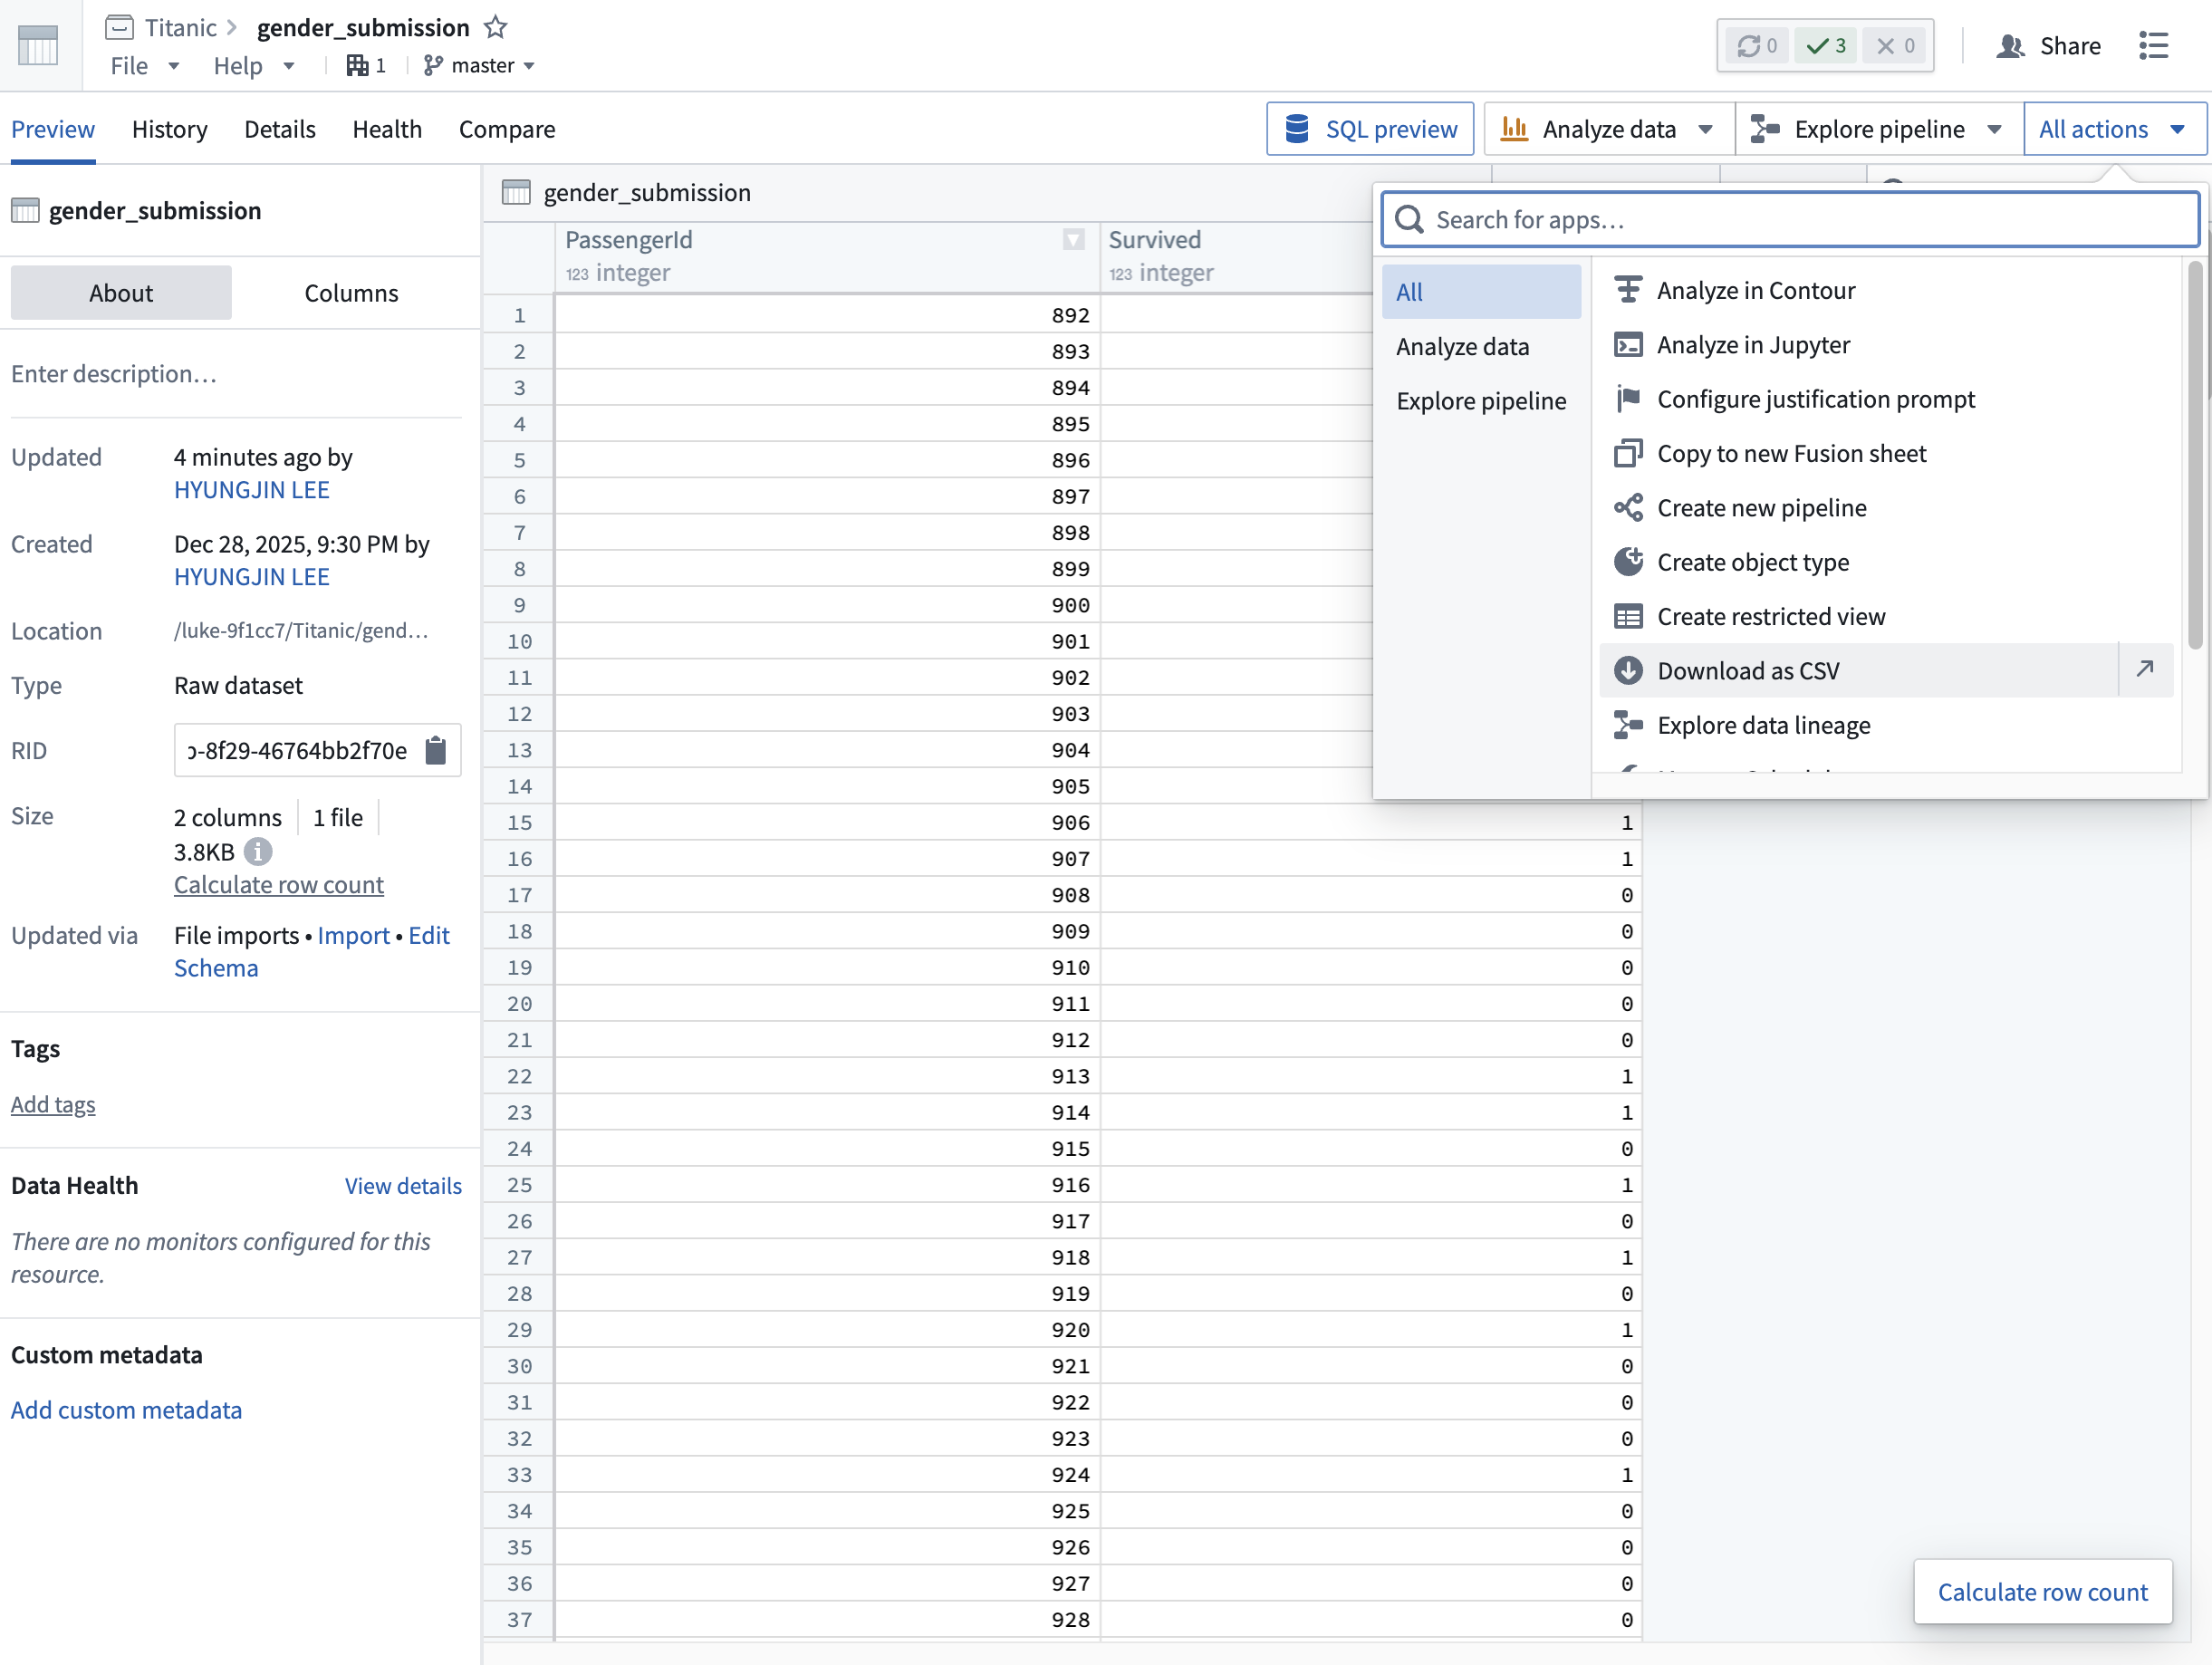
2) All actions → Download as CSV
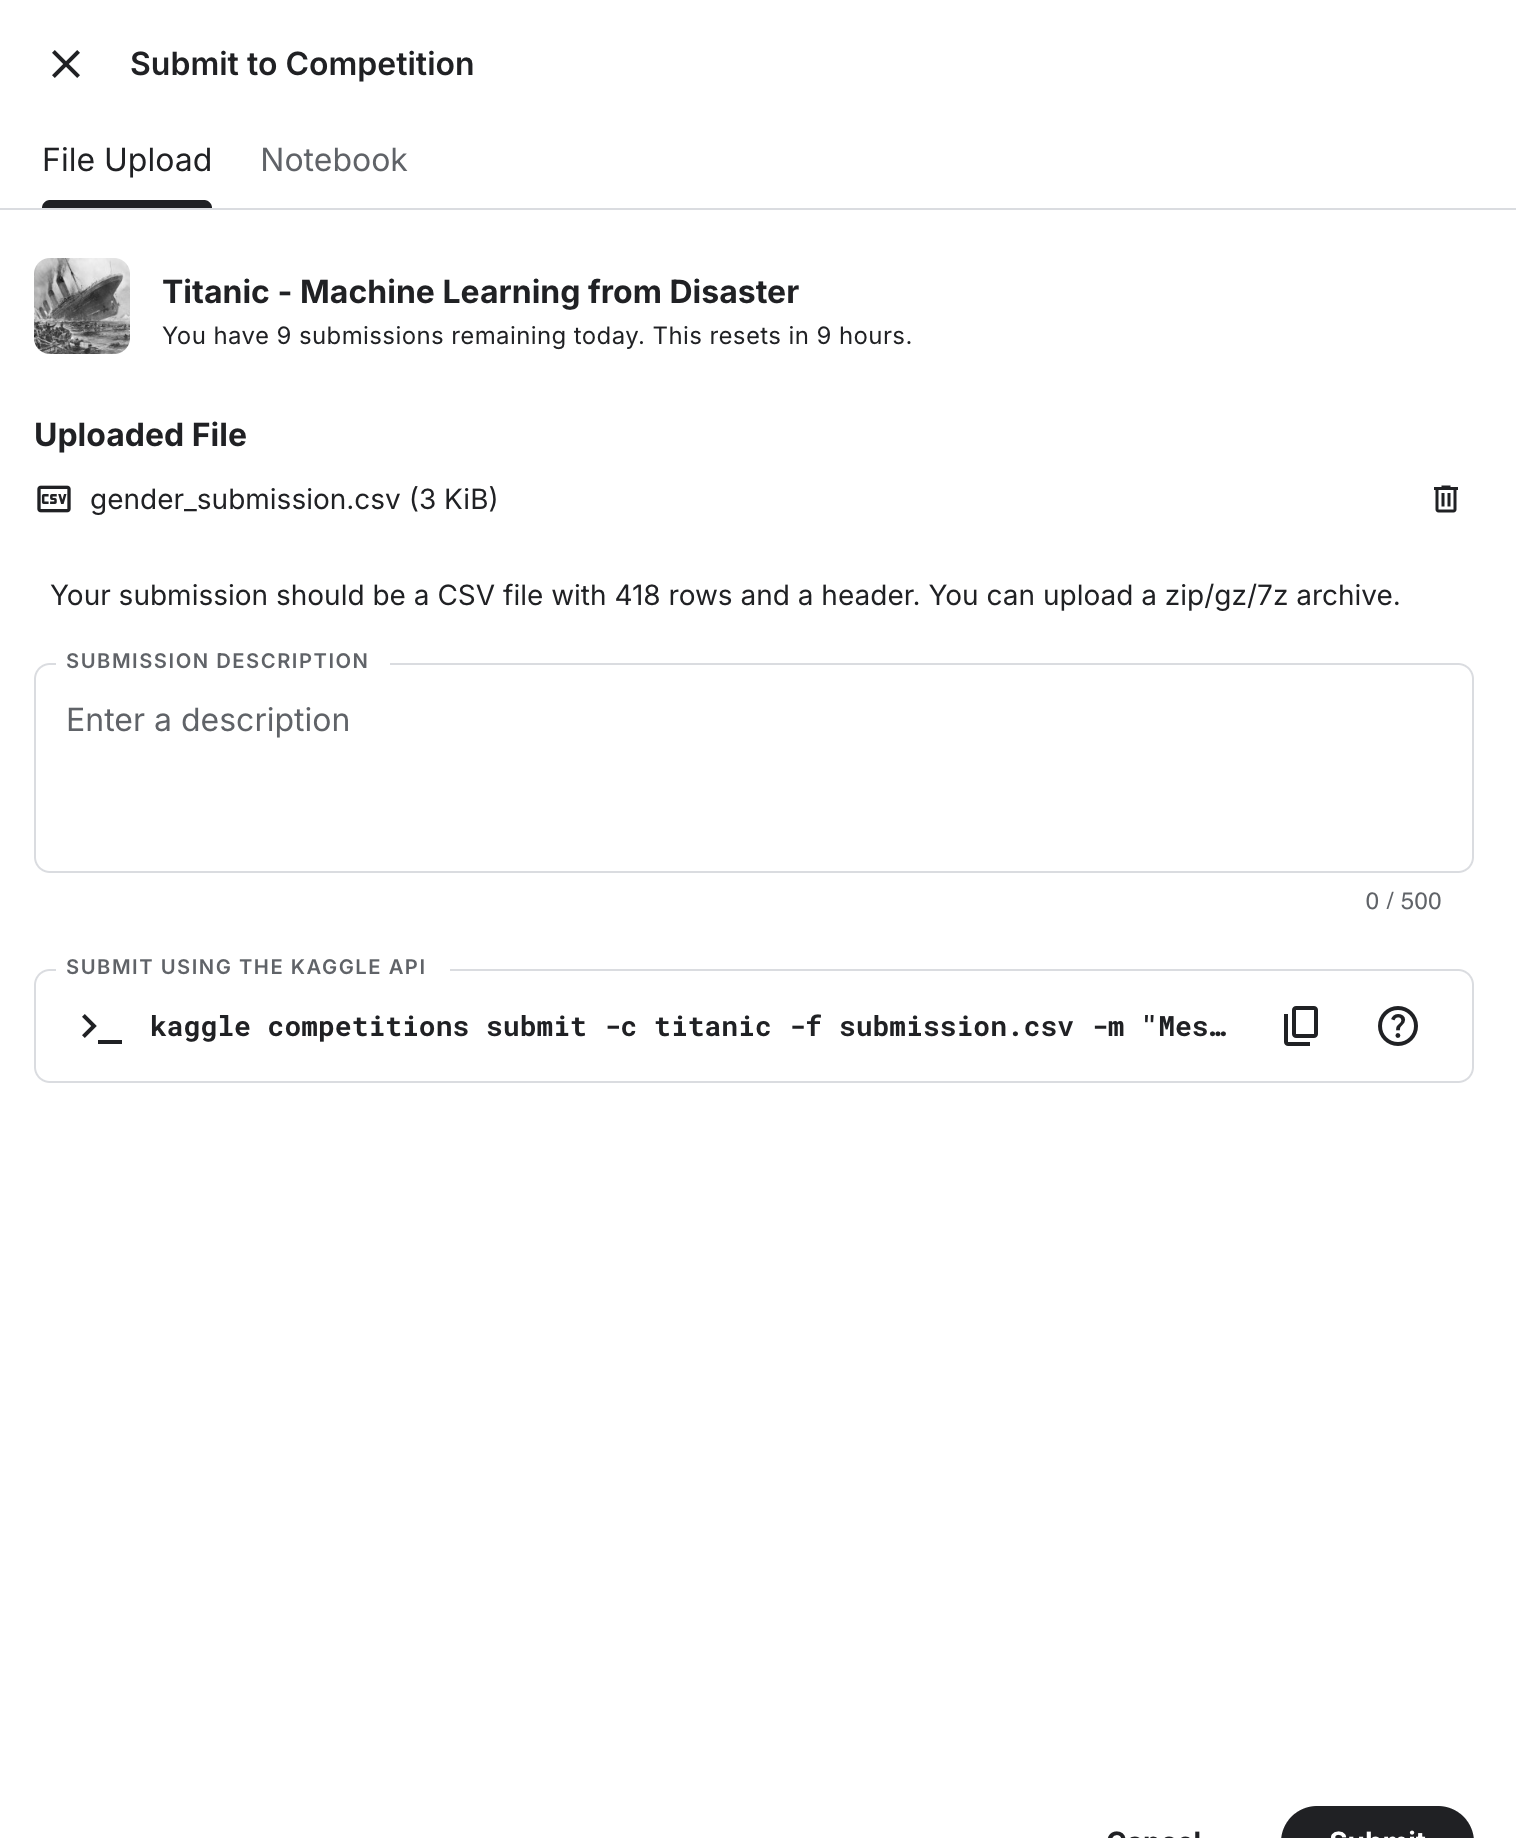
3) On Kaggle, open Submit Predictions, upload the CSV, and submit.
4) You should see a score (e.g., 0.76315).
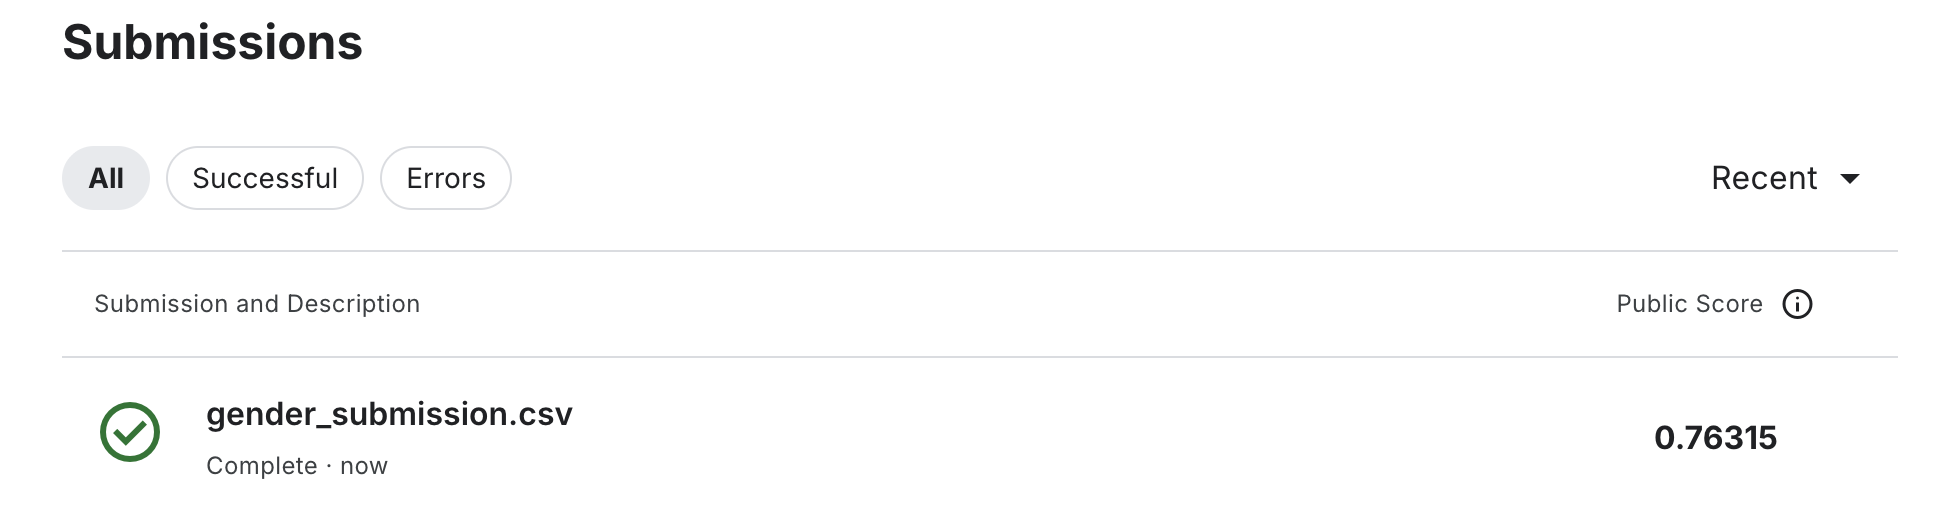
From here, you can improve the score by iterating on features, model choice, and hyperparameters.
4. Visualize results in Workshop (Ontology)
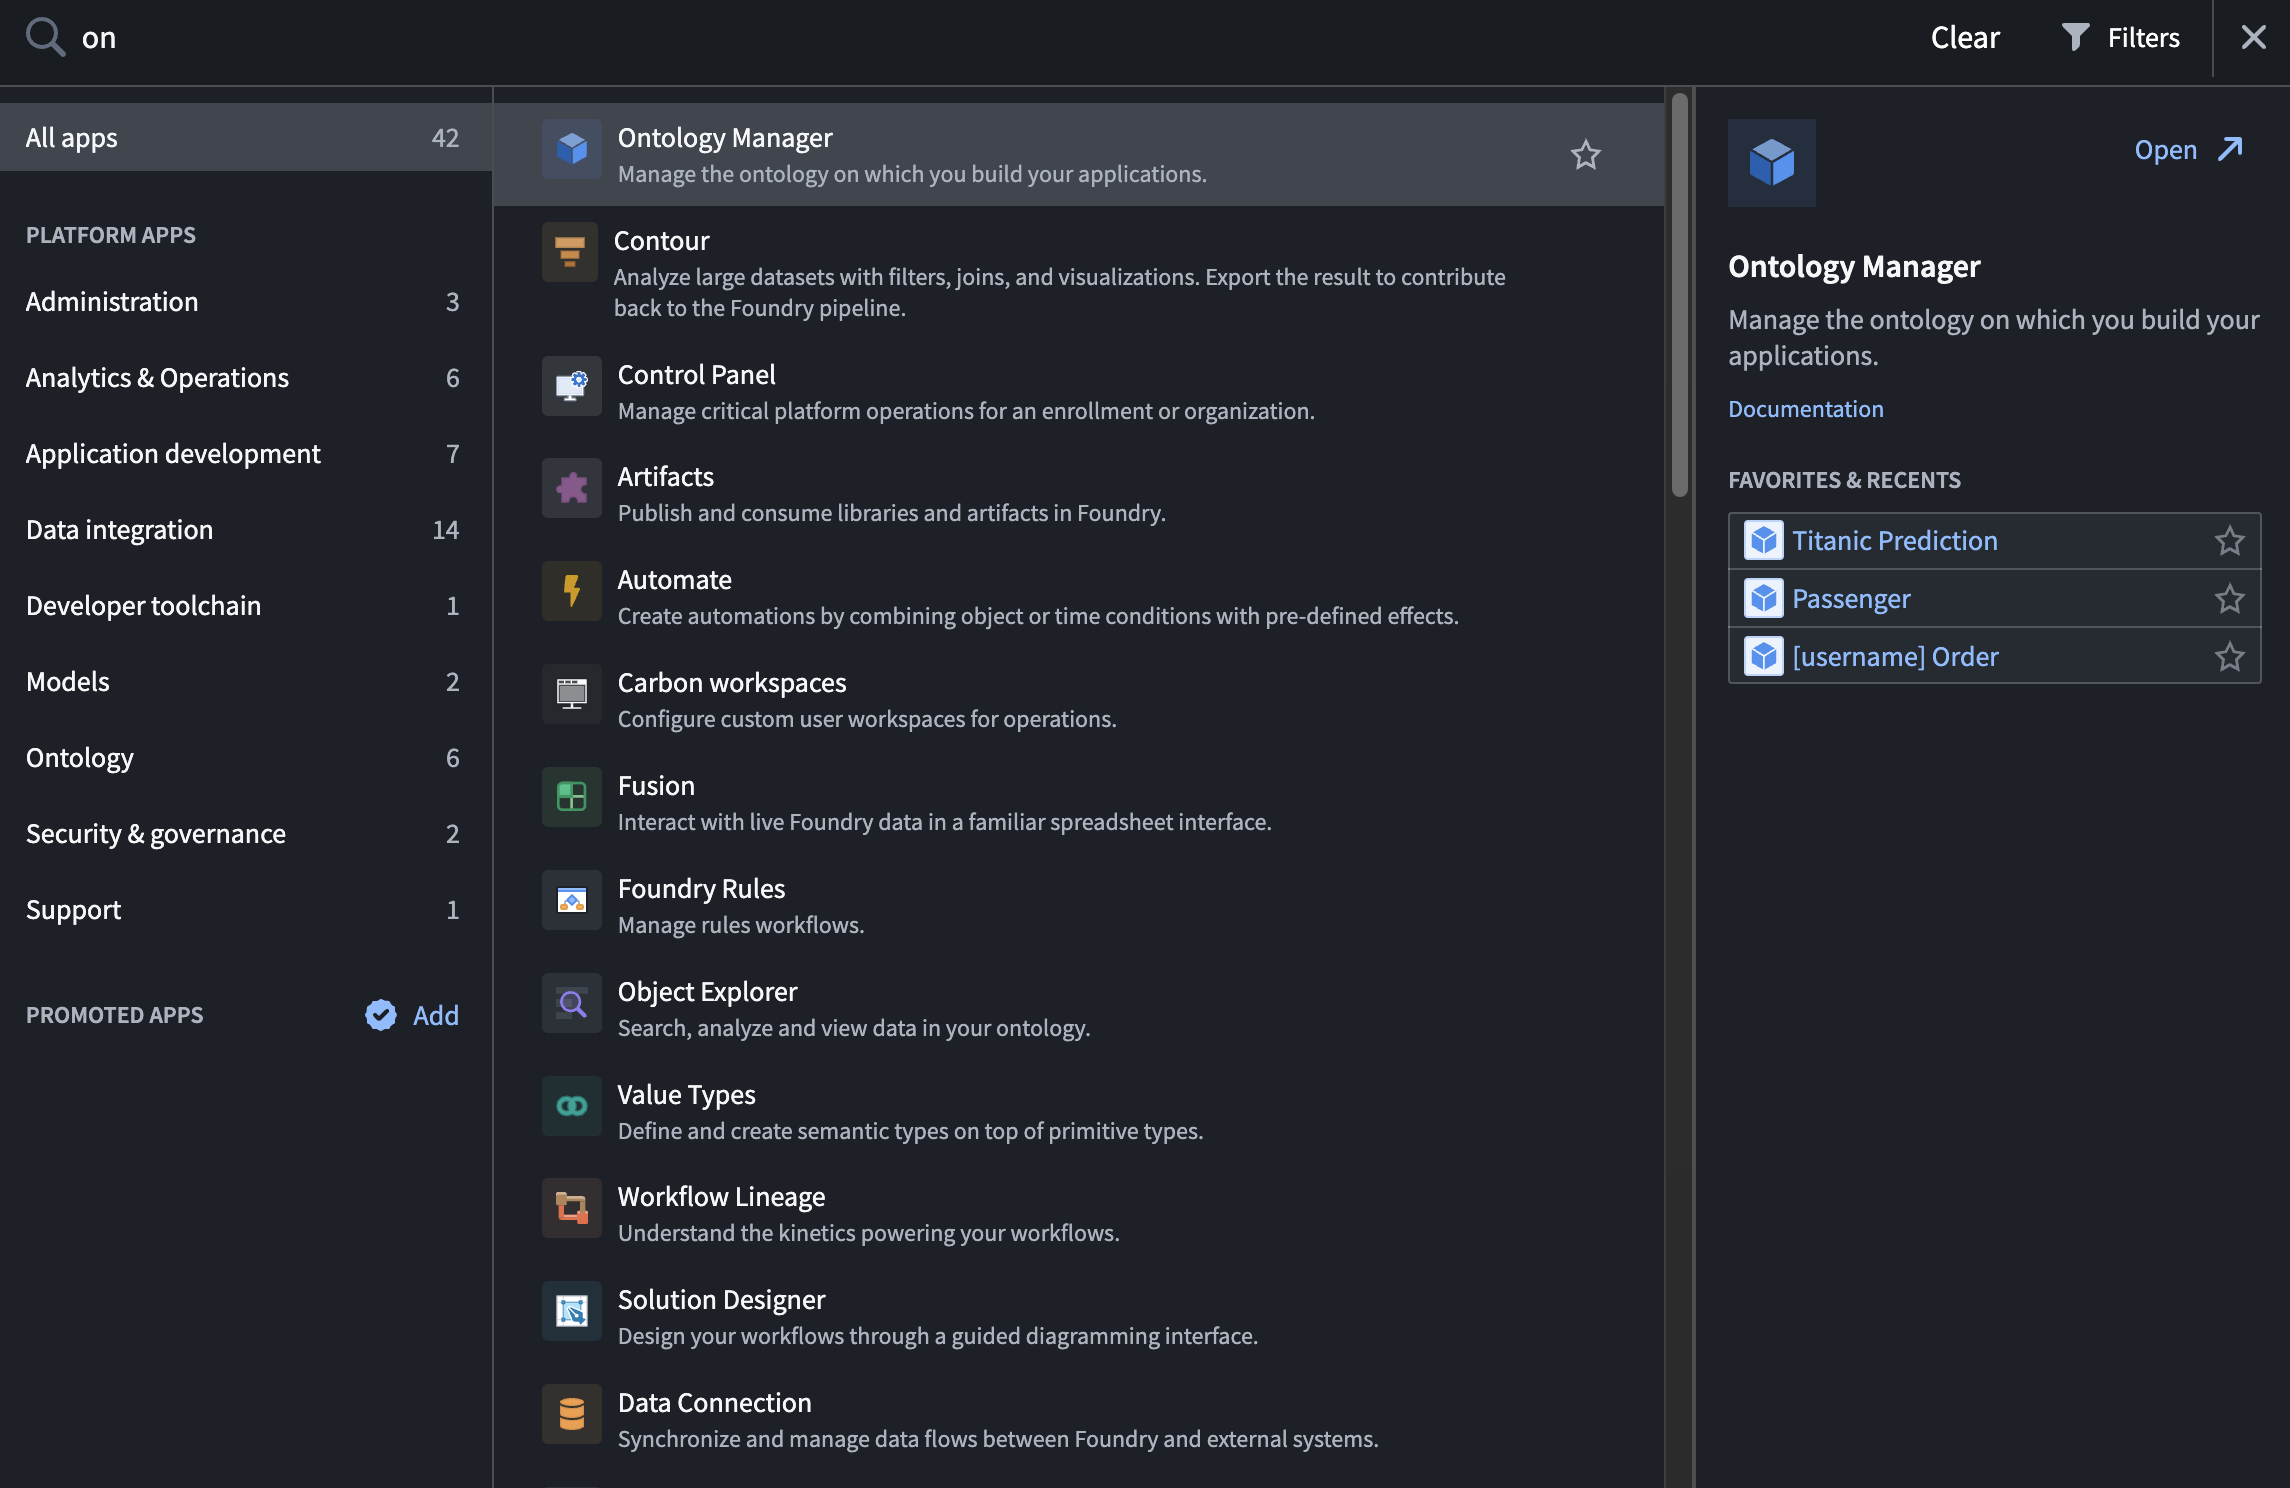
4.1 Create an Ontology (connect the result dataset)
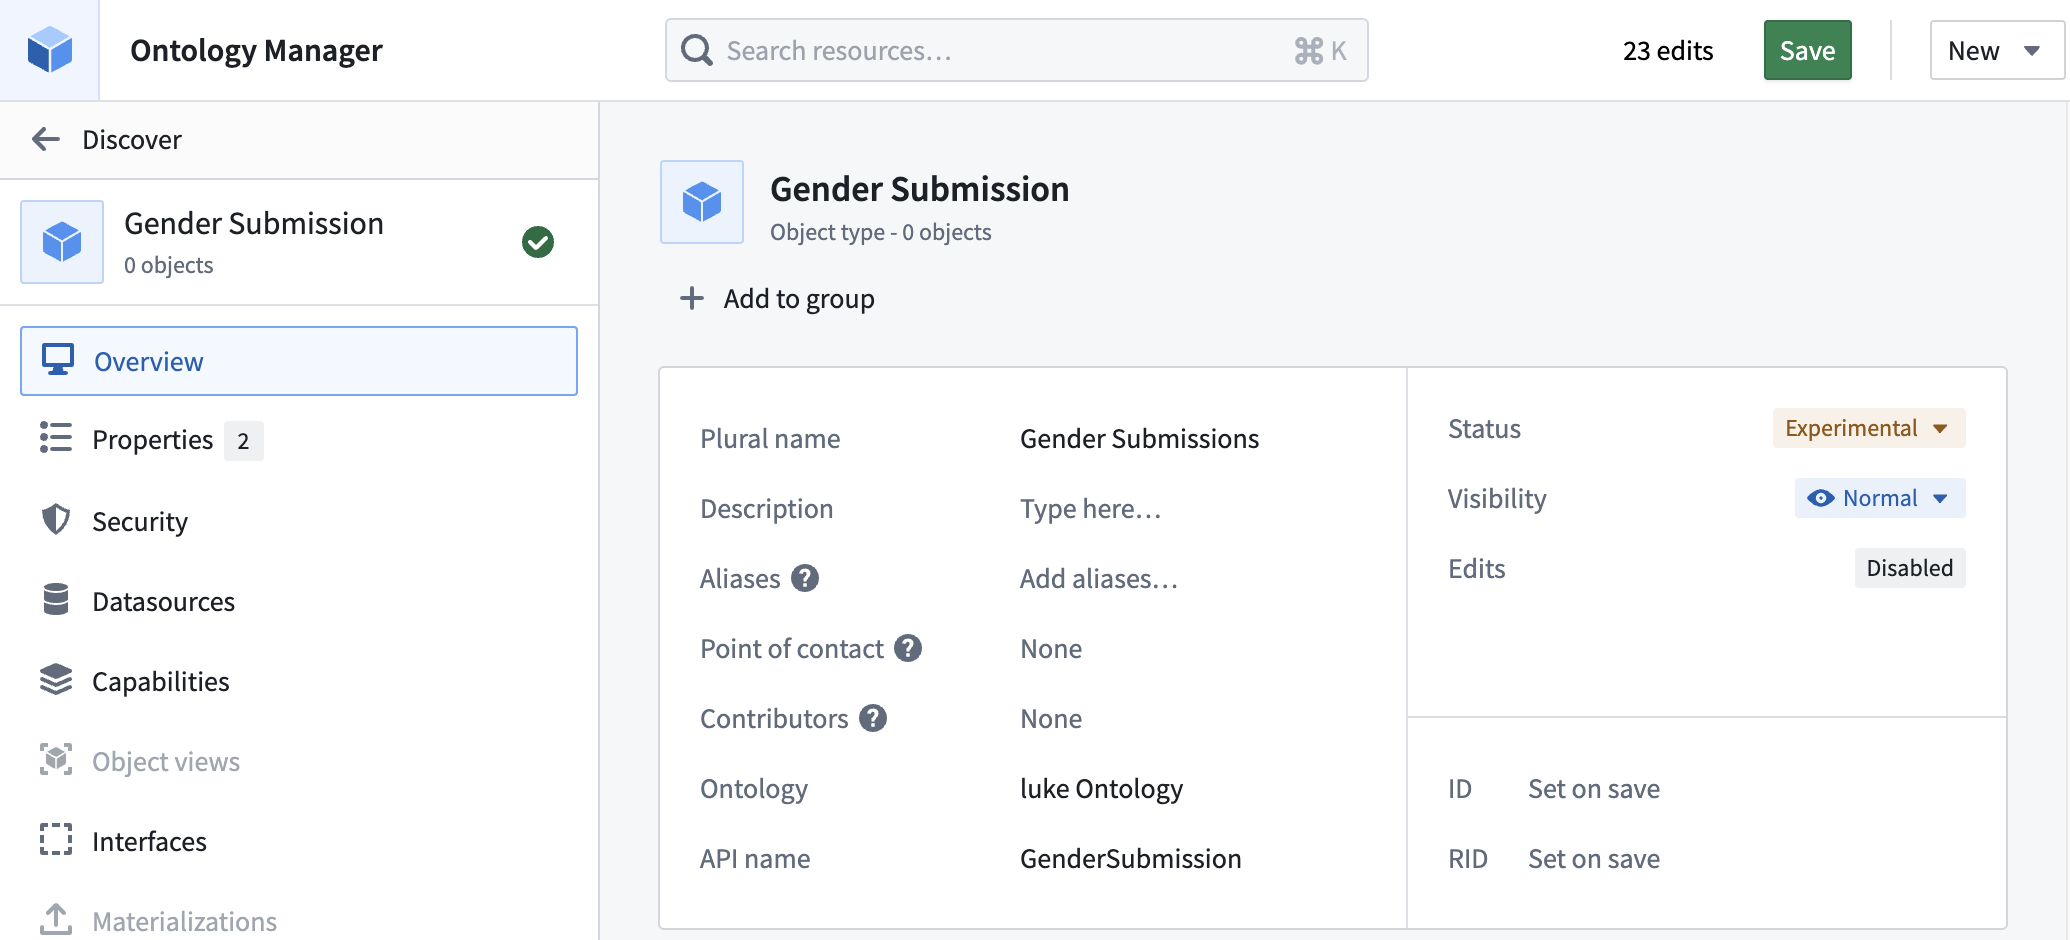
1) In Application, search for ontology → open Ontology Manager.
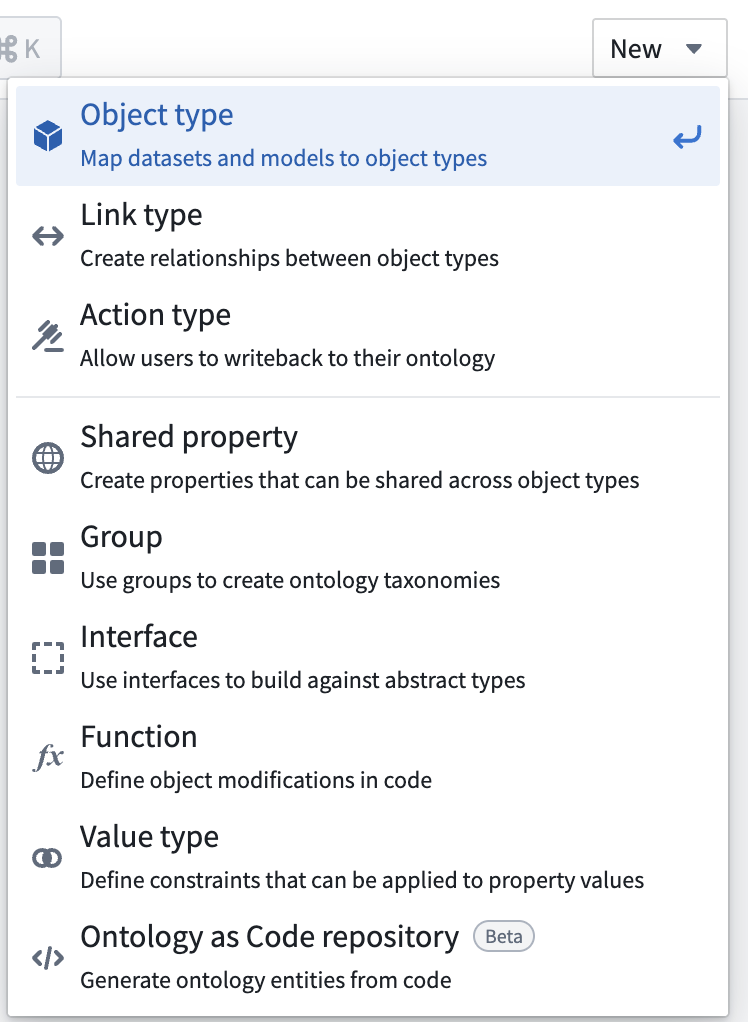
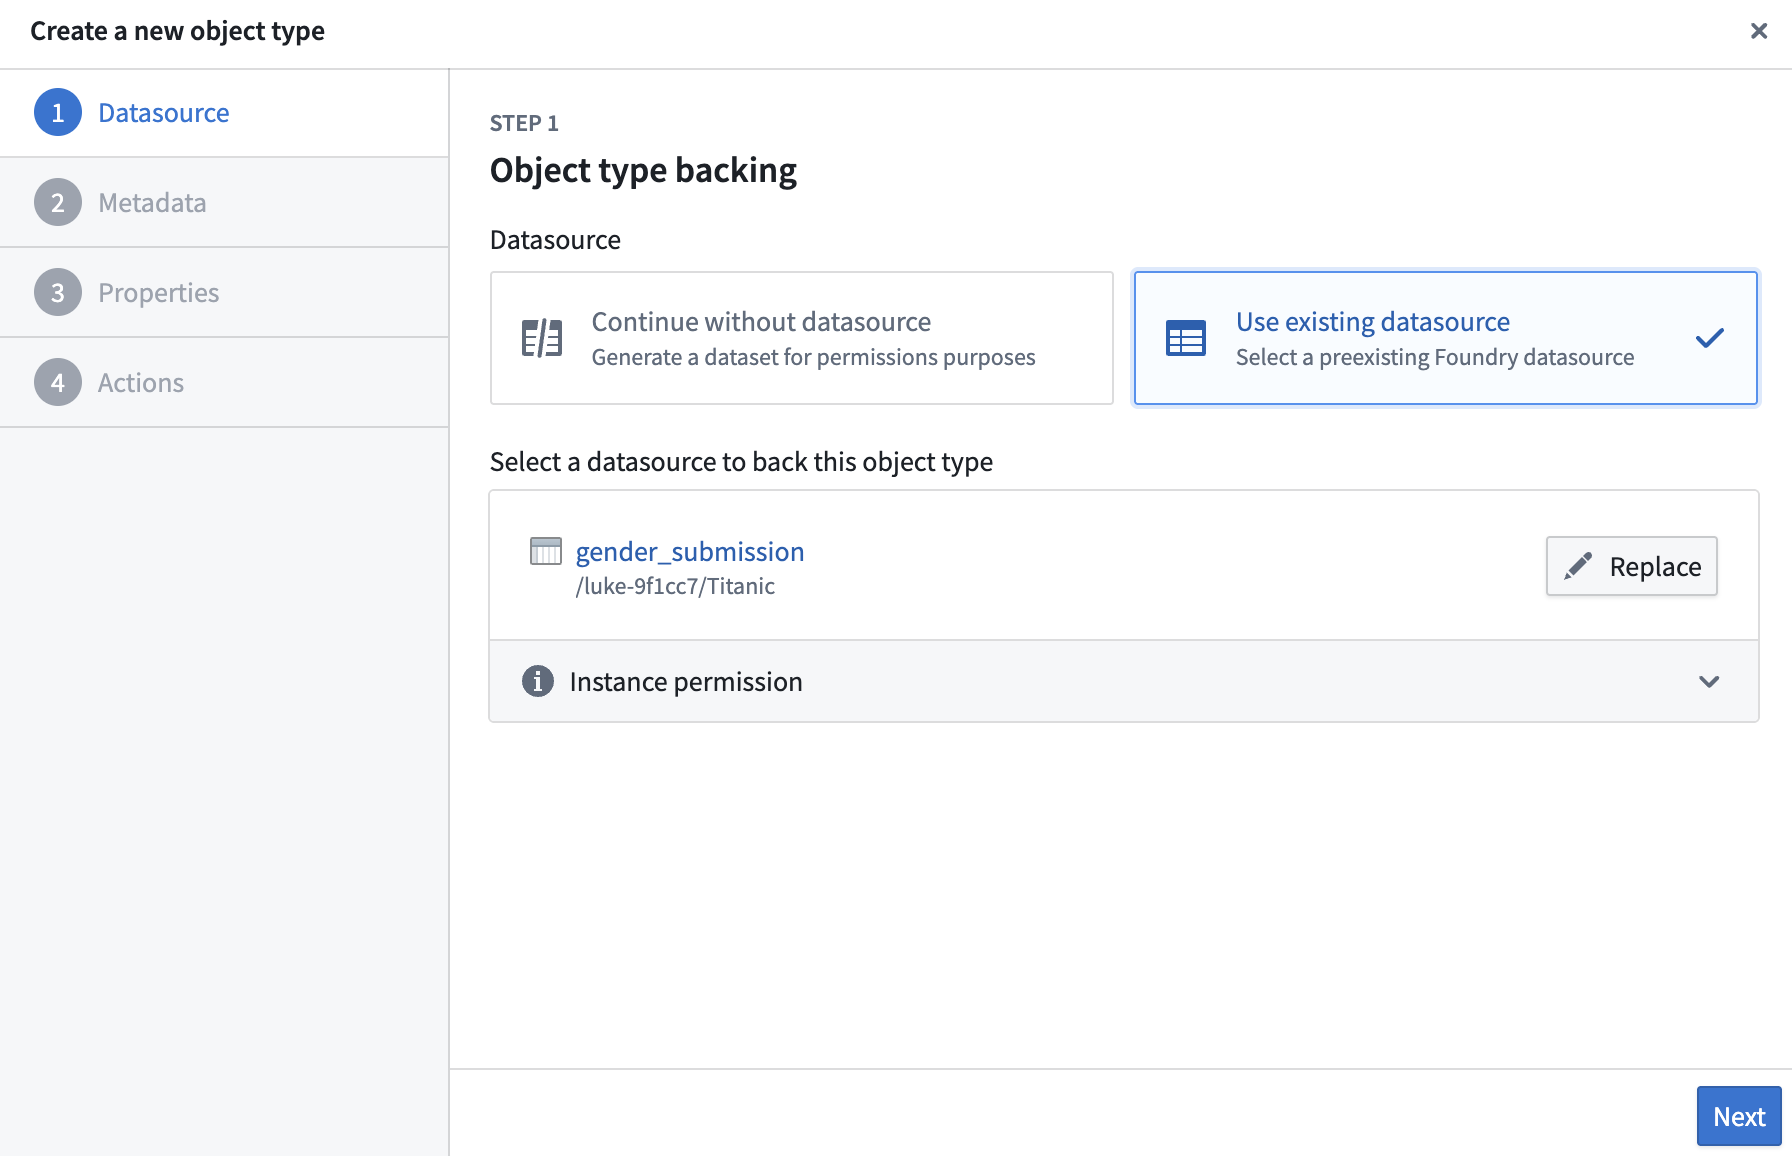
2) Click New → Object type.
3) Choose Use existing datasource → Select datasource → pick gender_submission.
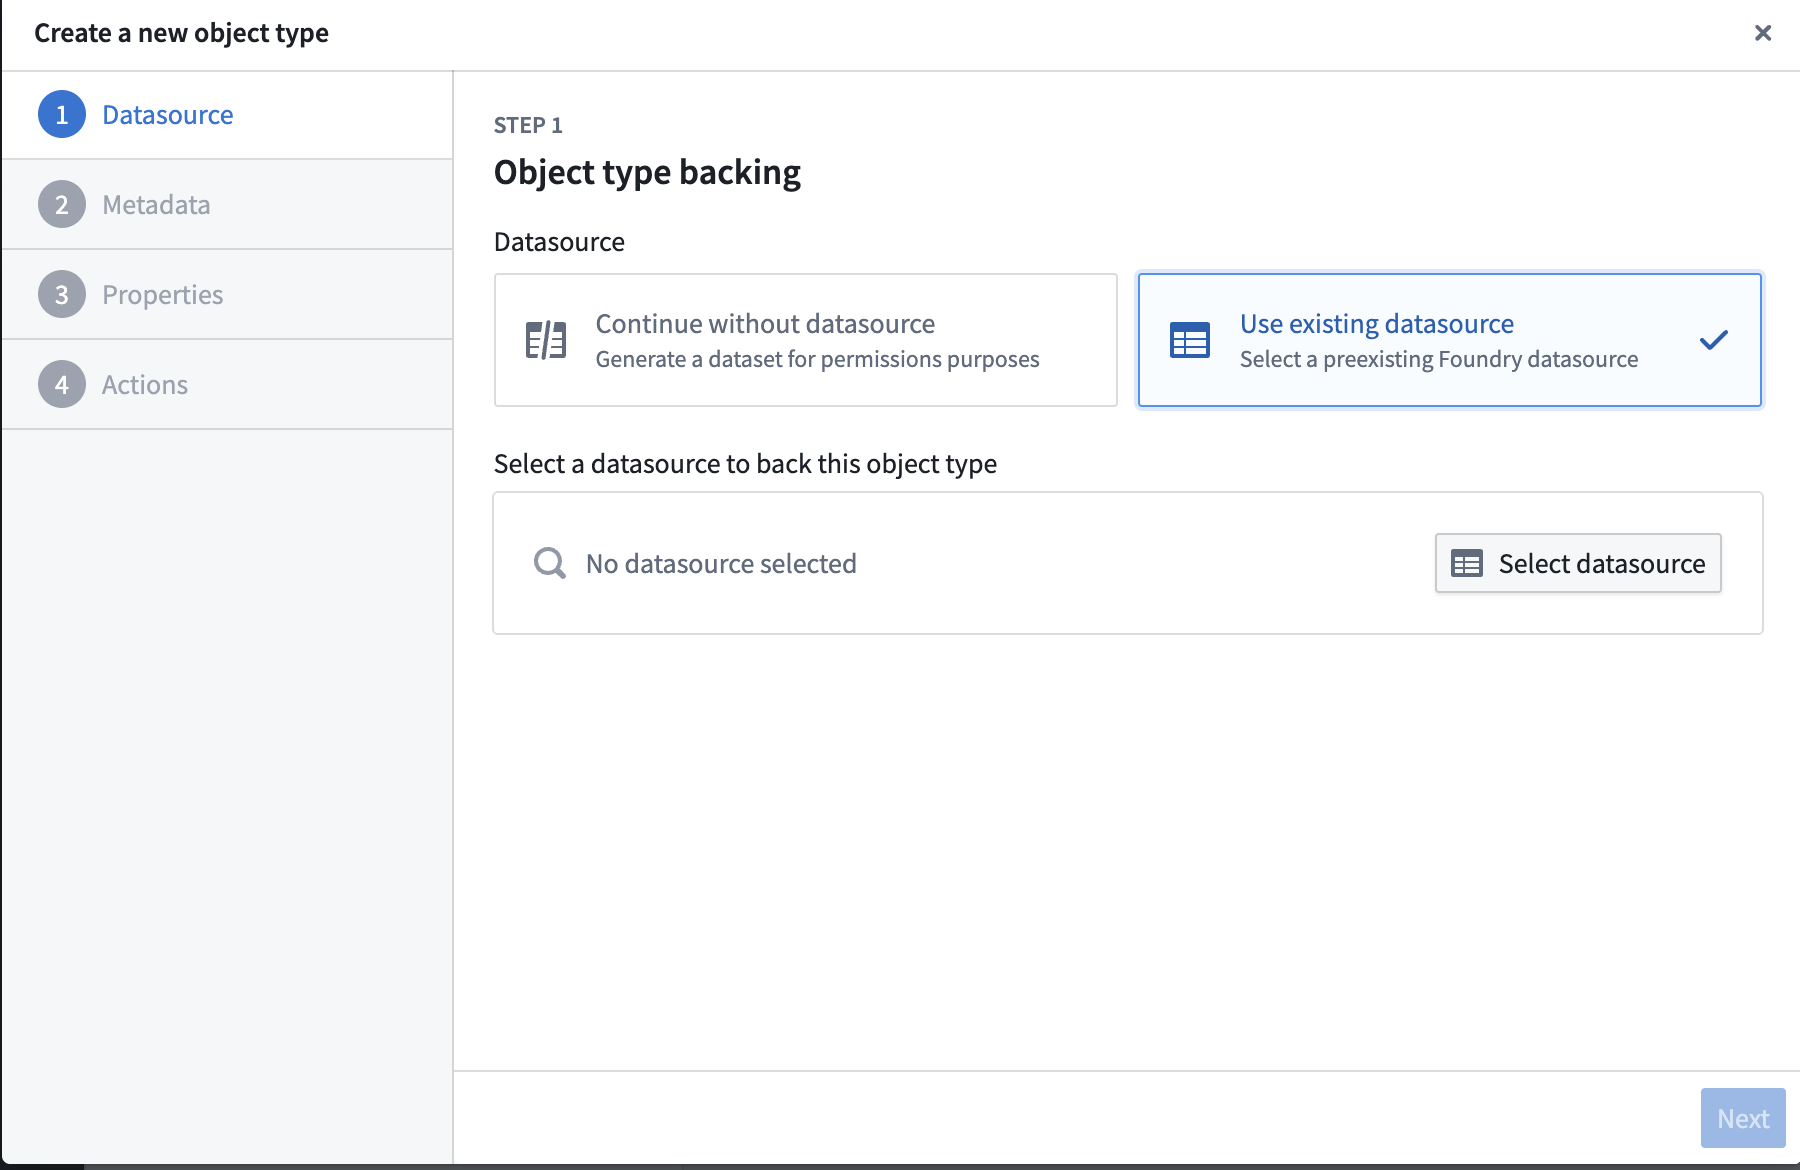

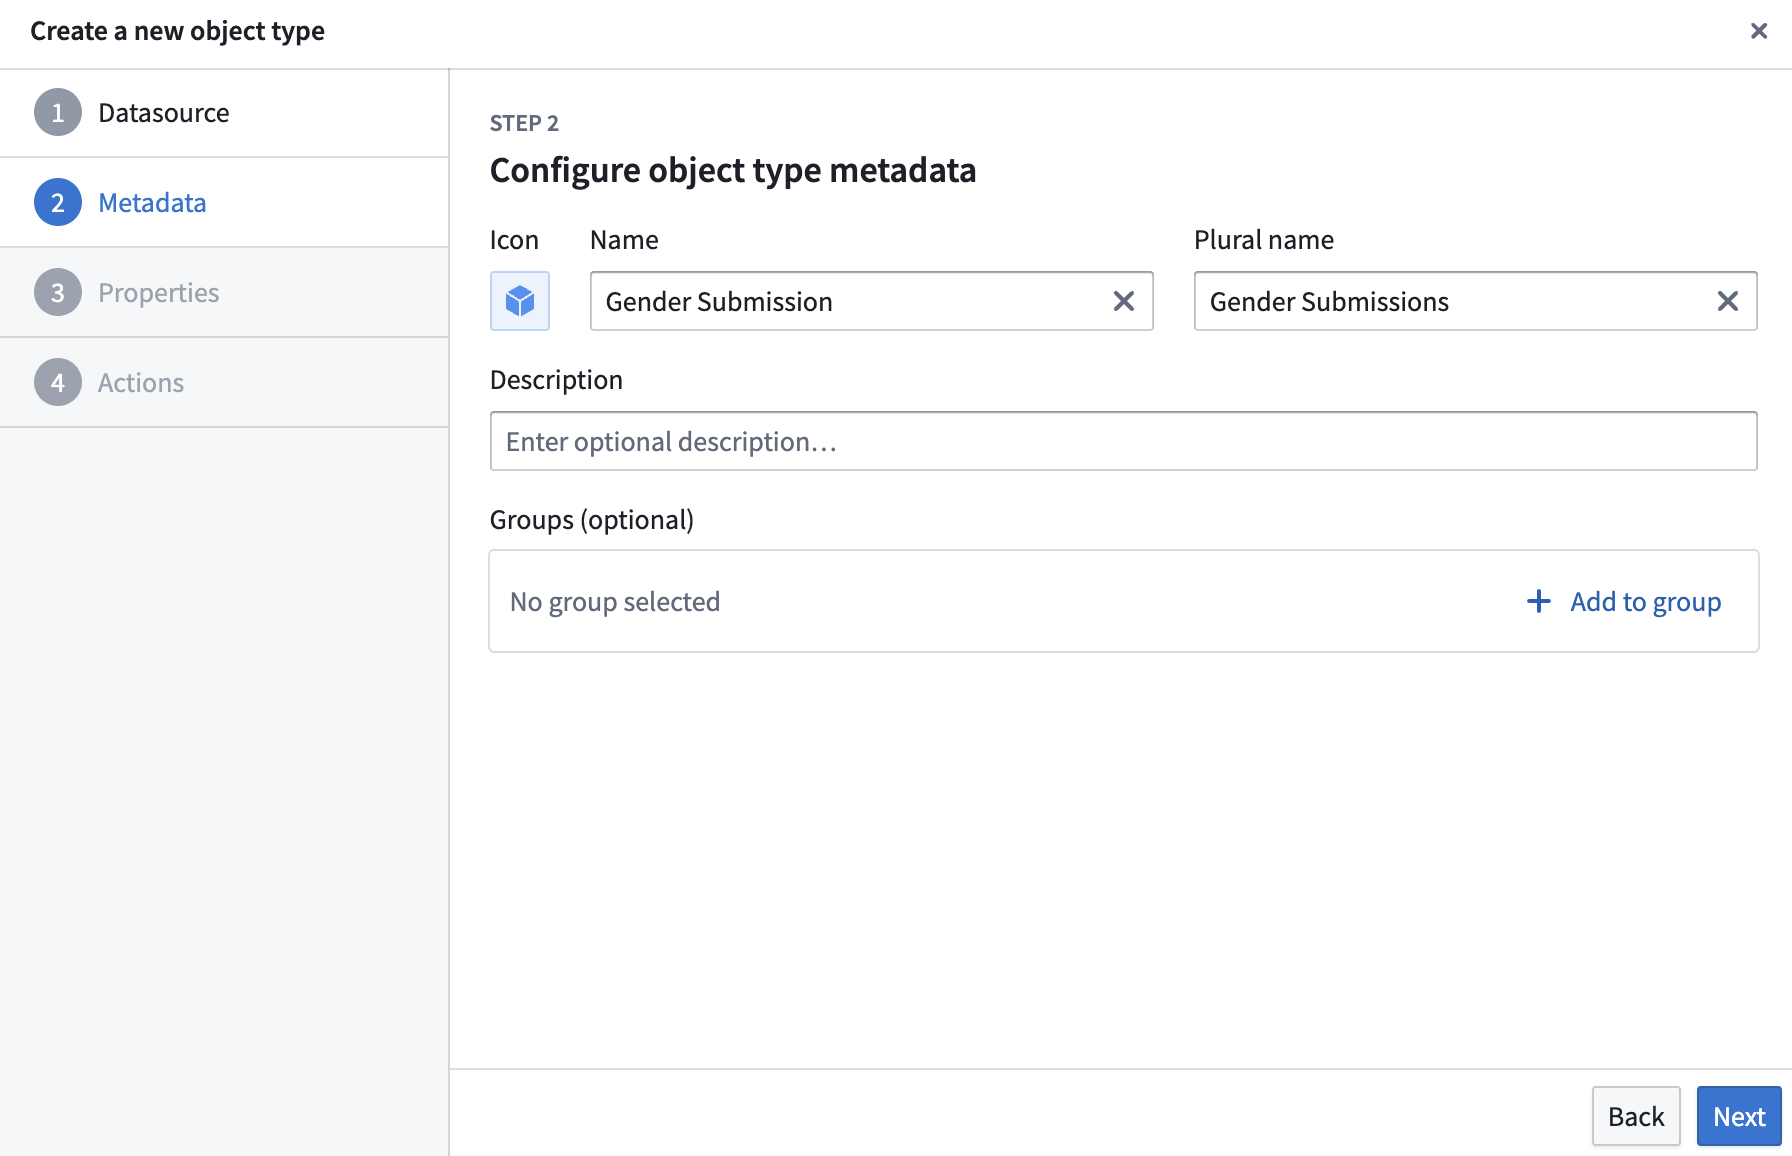
4) Click Next → and Next again on Step 2.
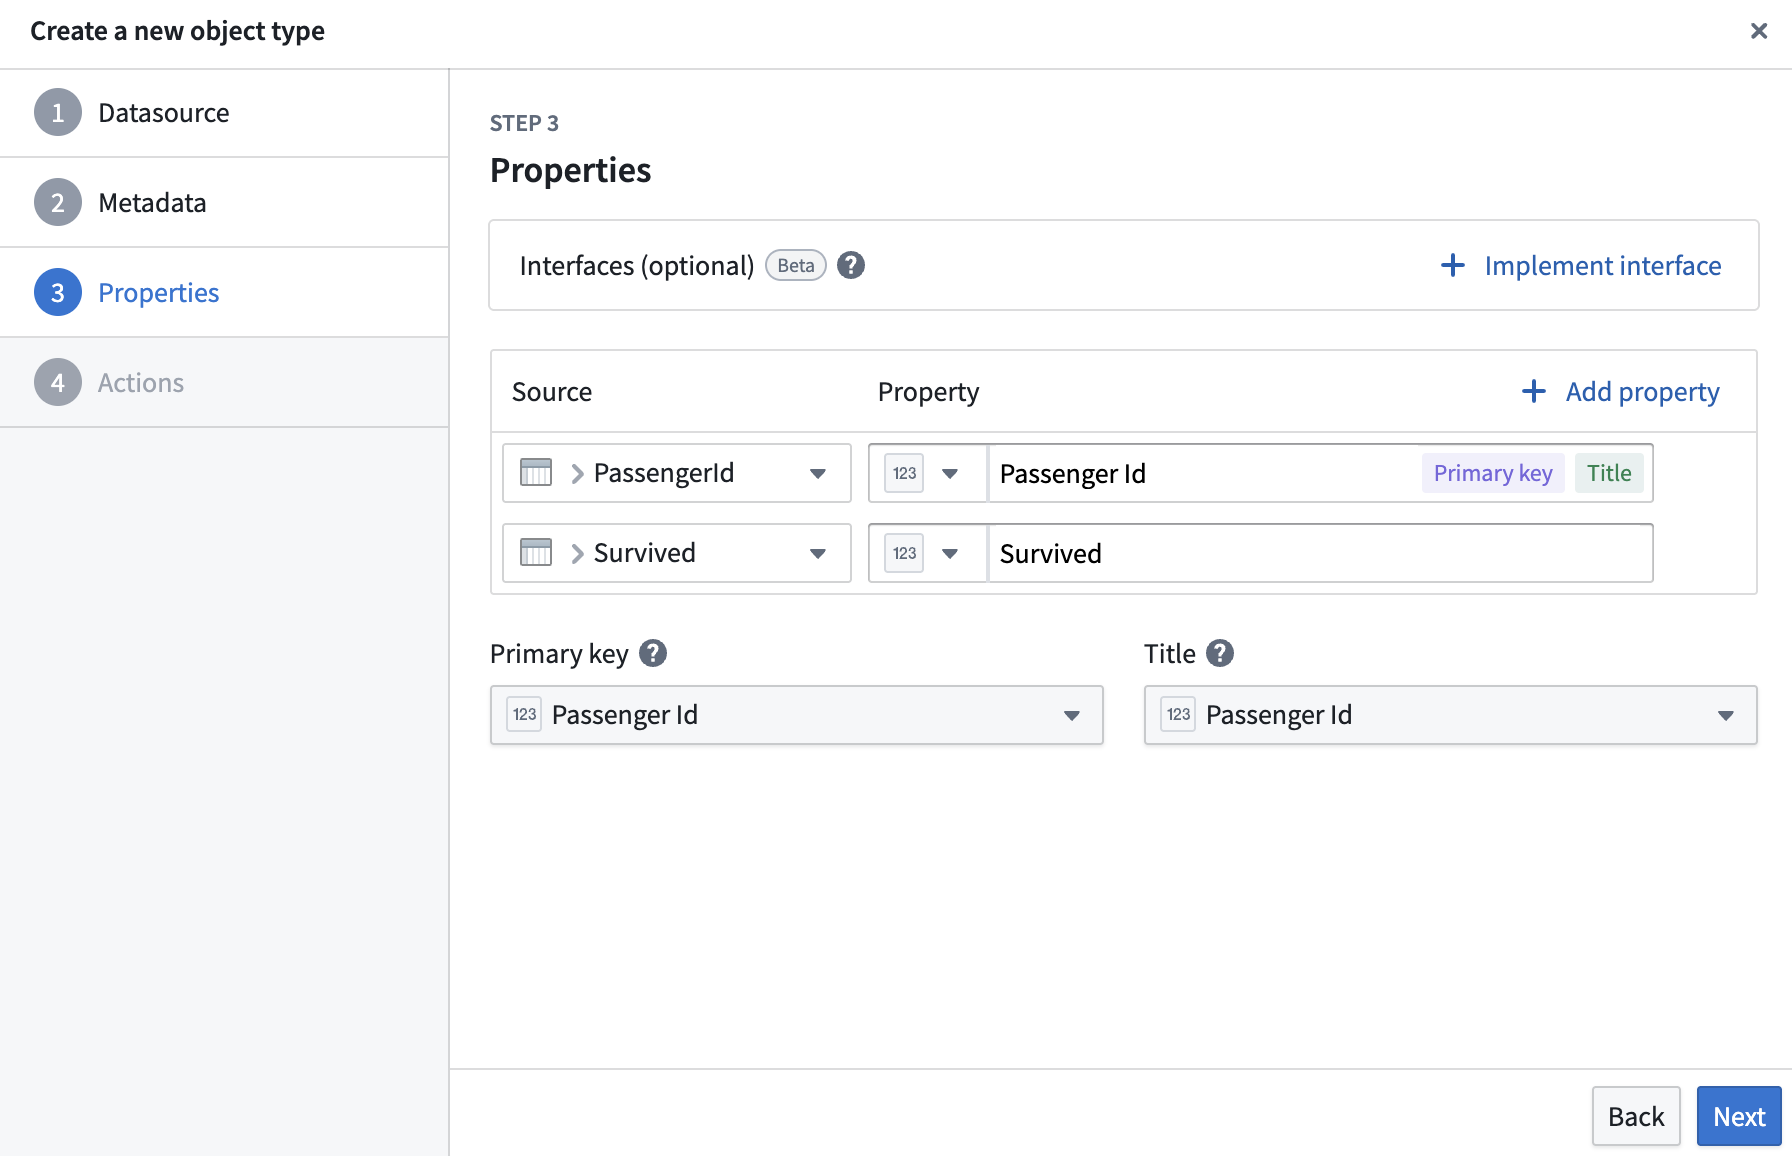
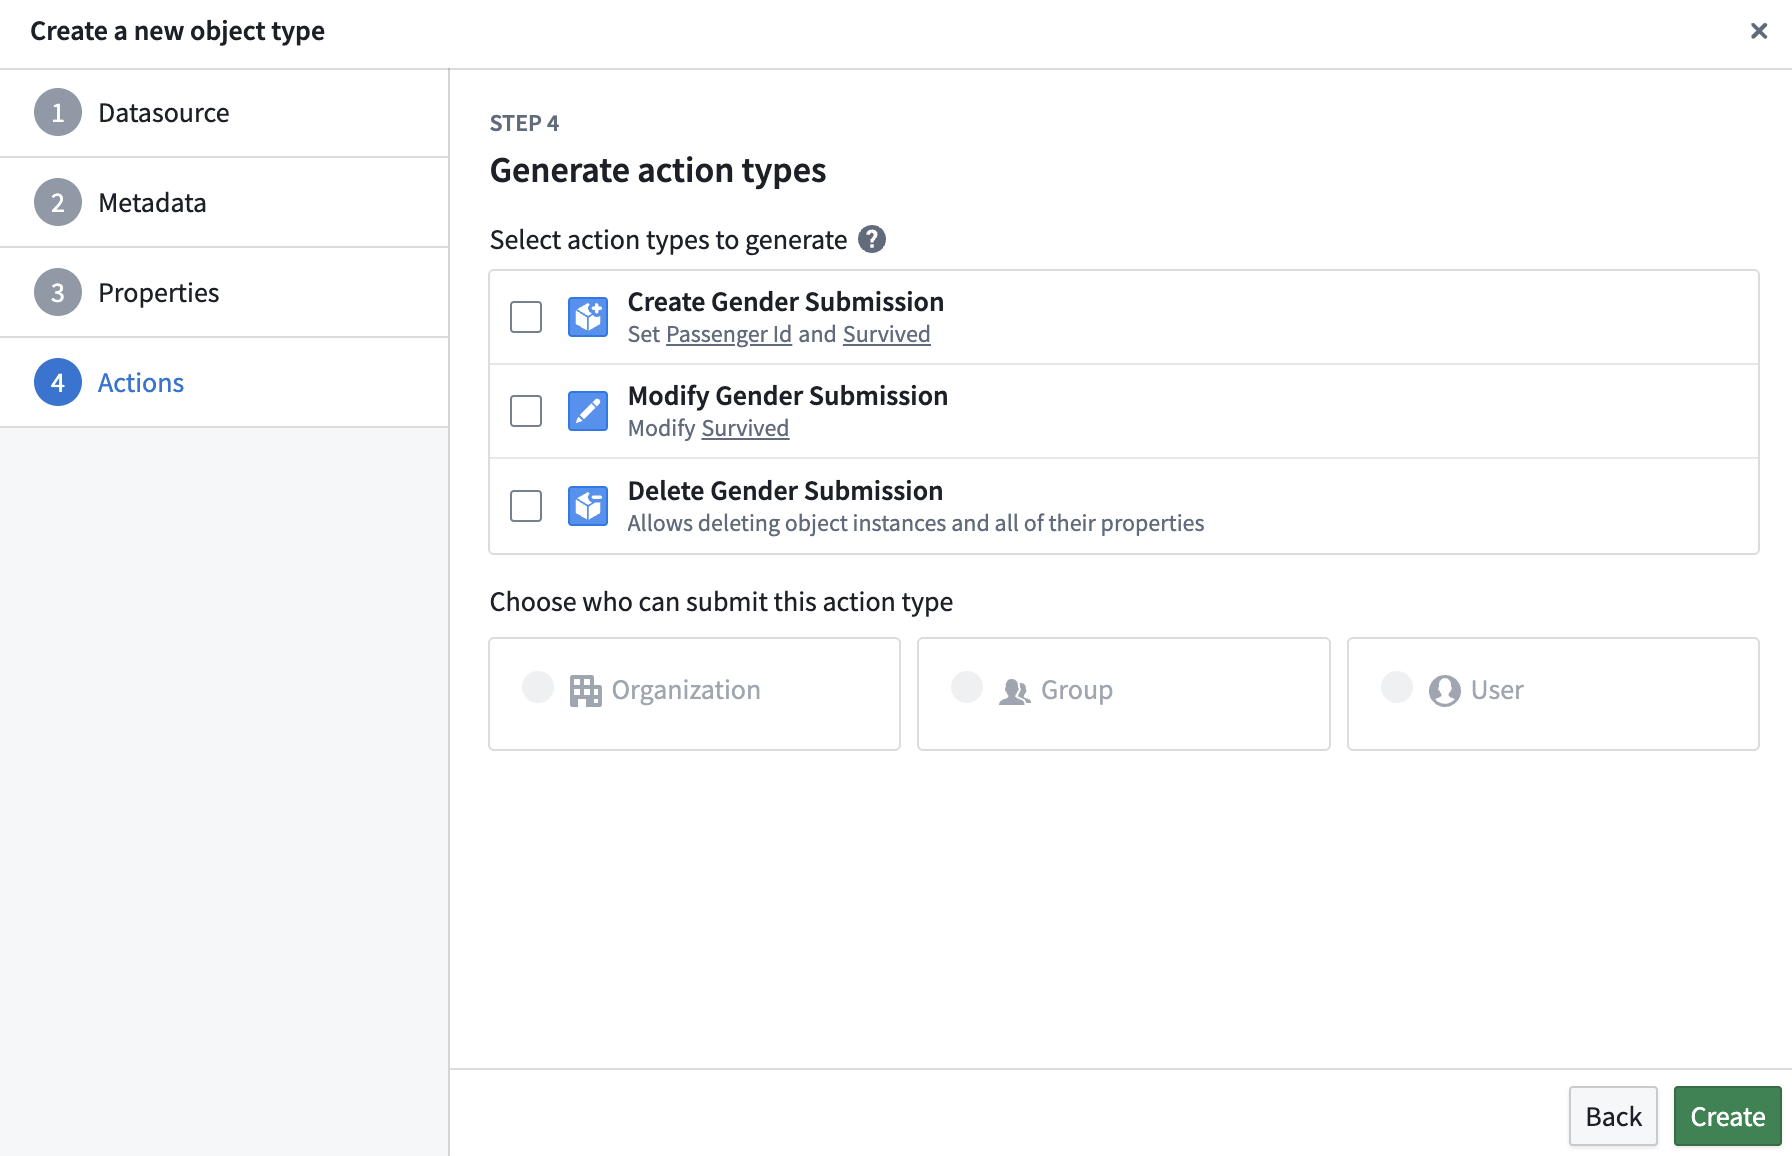
5) Set Primary key and Title to Passenger Id → click Create.
6) Click Save.
4.2 Build a Workshop dashboard
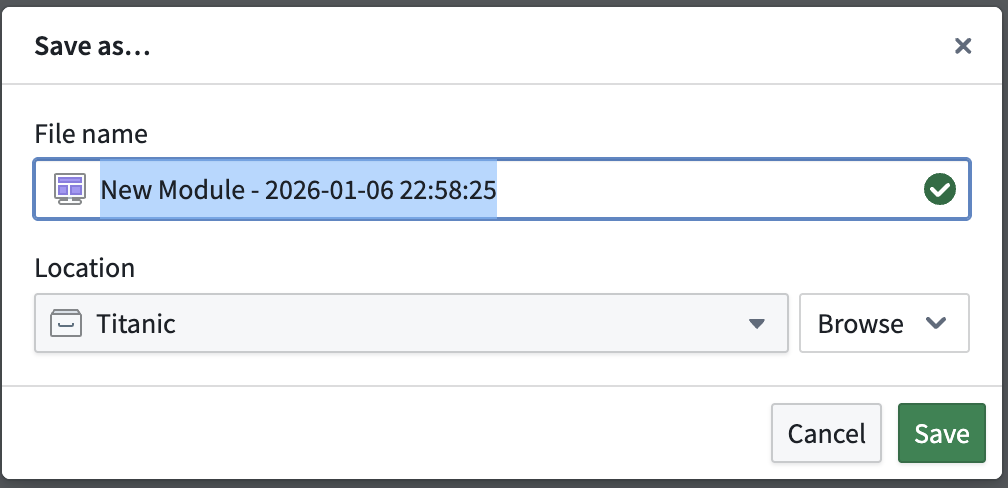
1) In Application, search for Workshop → Create new.

2) Click Save.
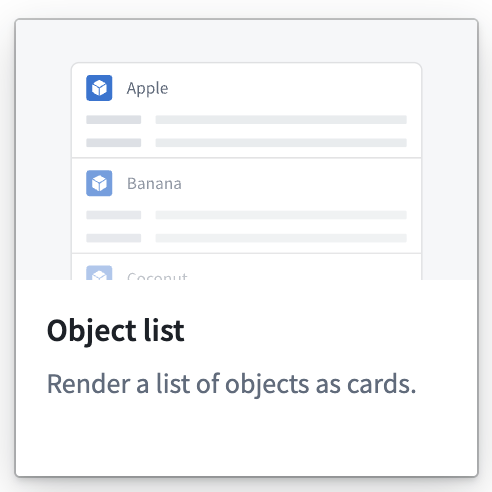
3) On the left, click Add widget → choose Object list.
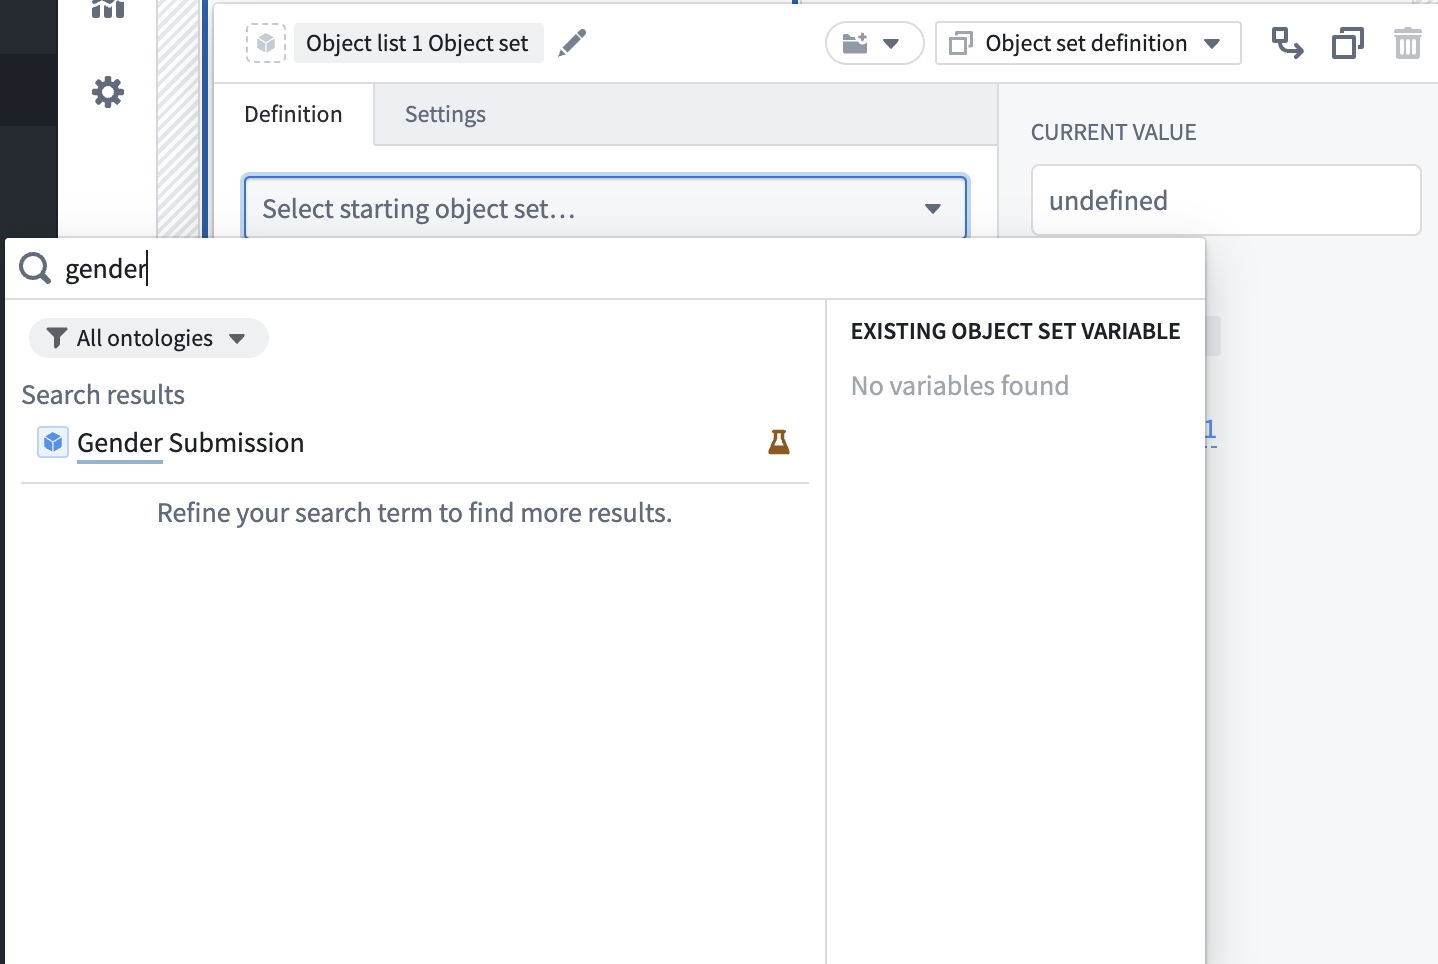
4) To set the input data, click New object set variable.
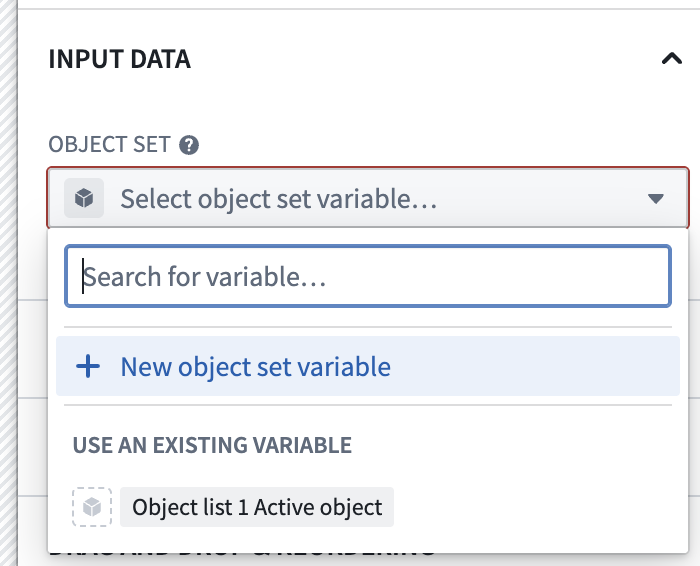
5) Click Select starting object set, search for gender, and select it.
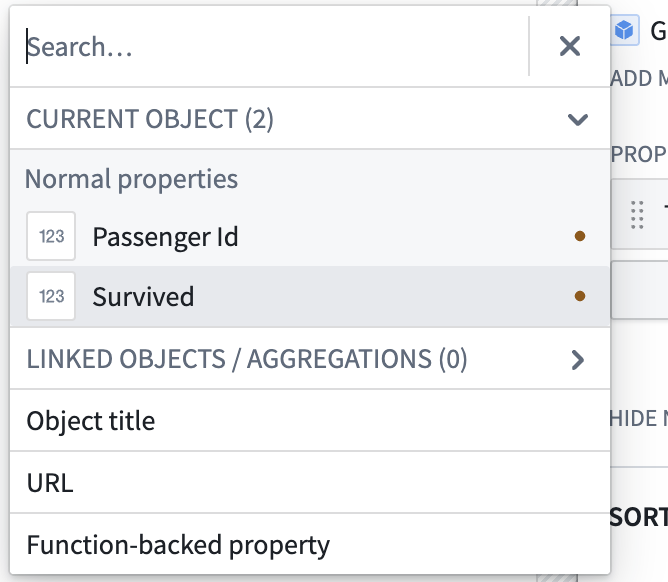
6) Click Add property → select Survived.
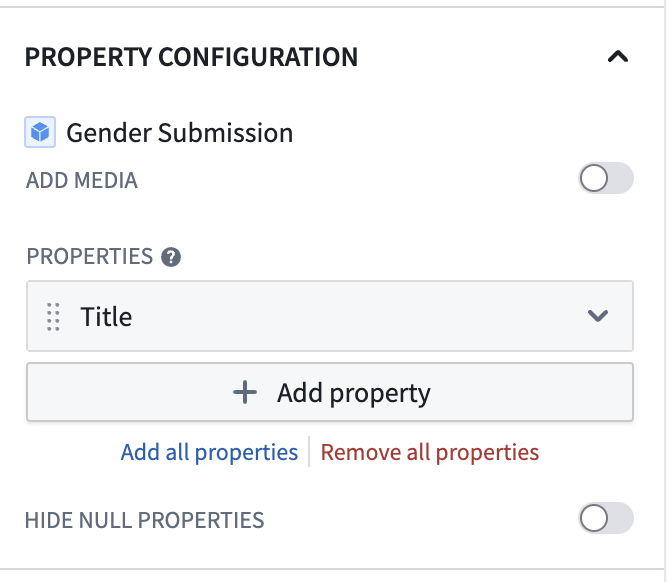
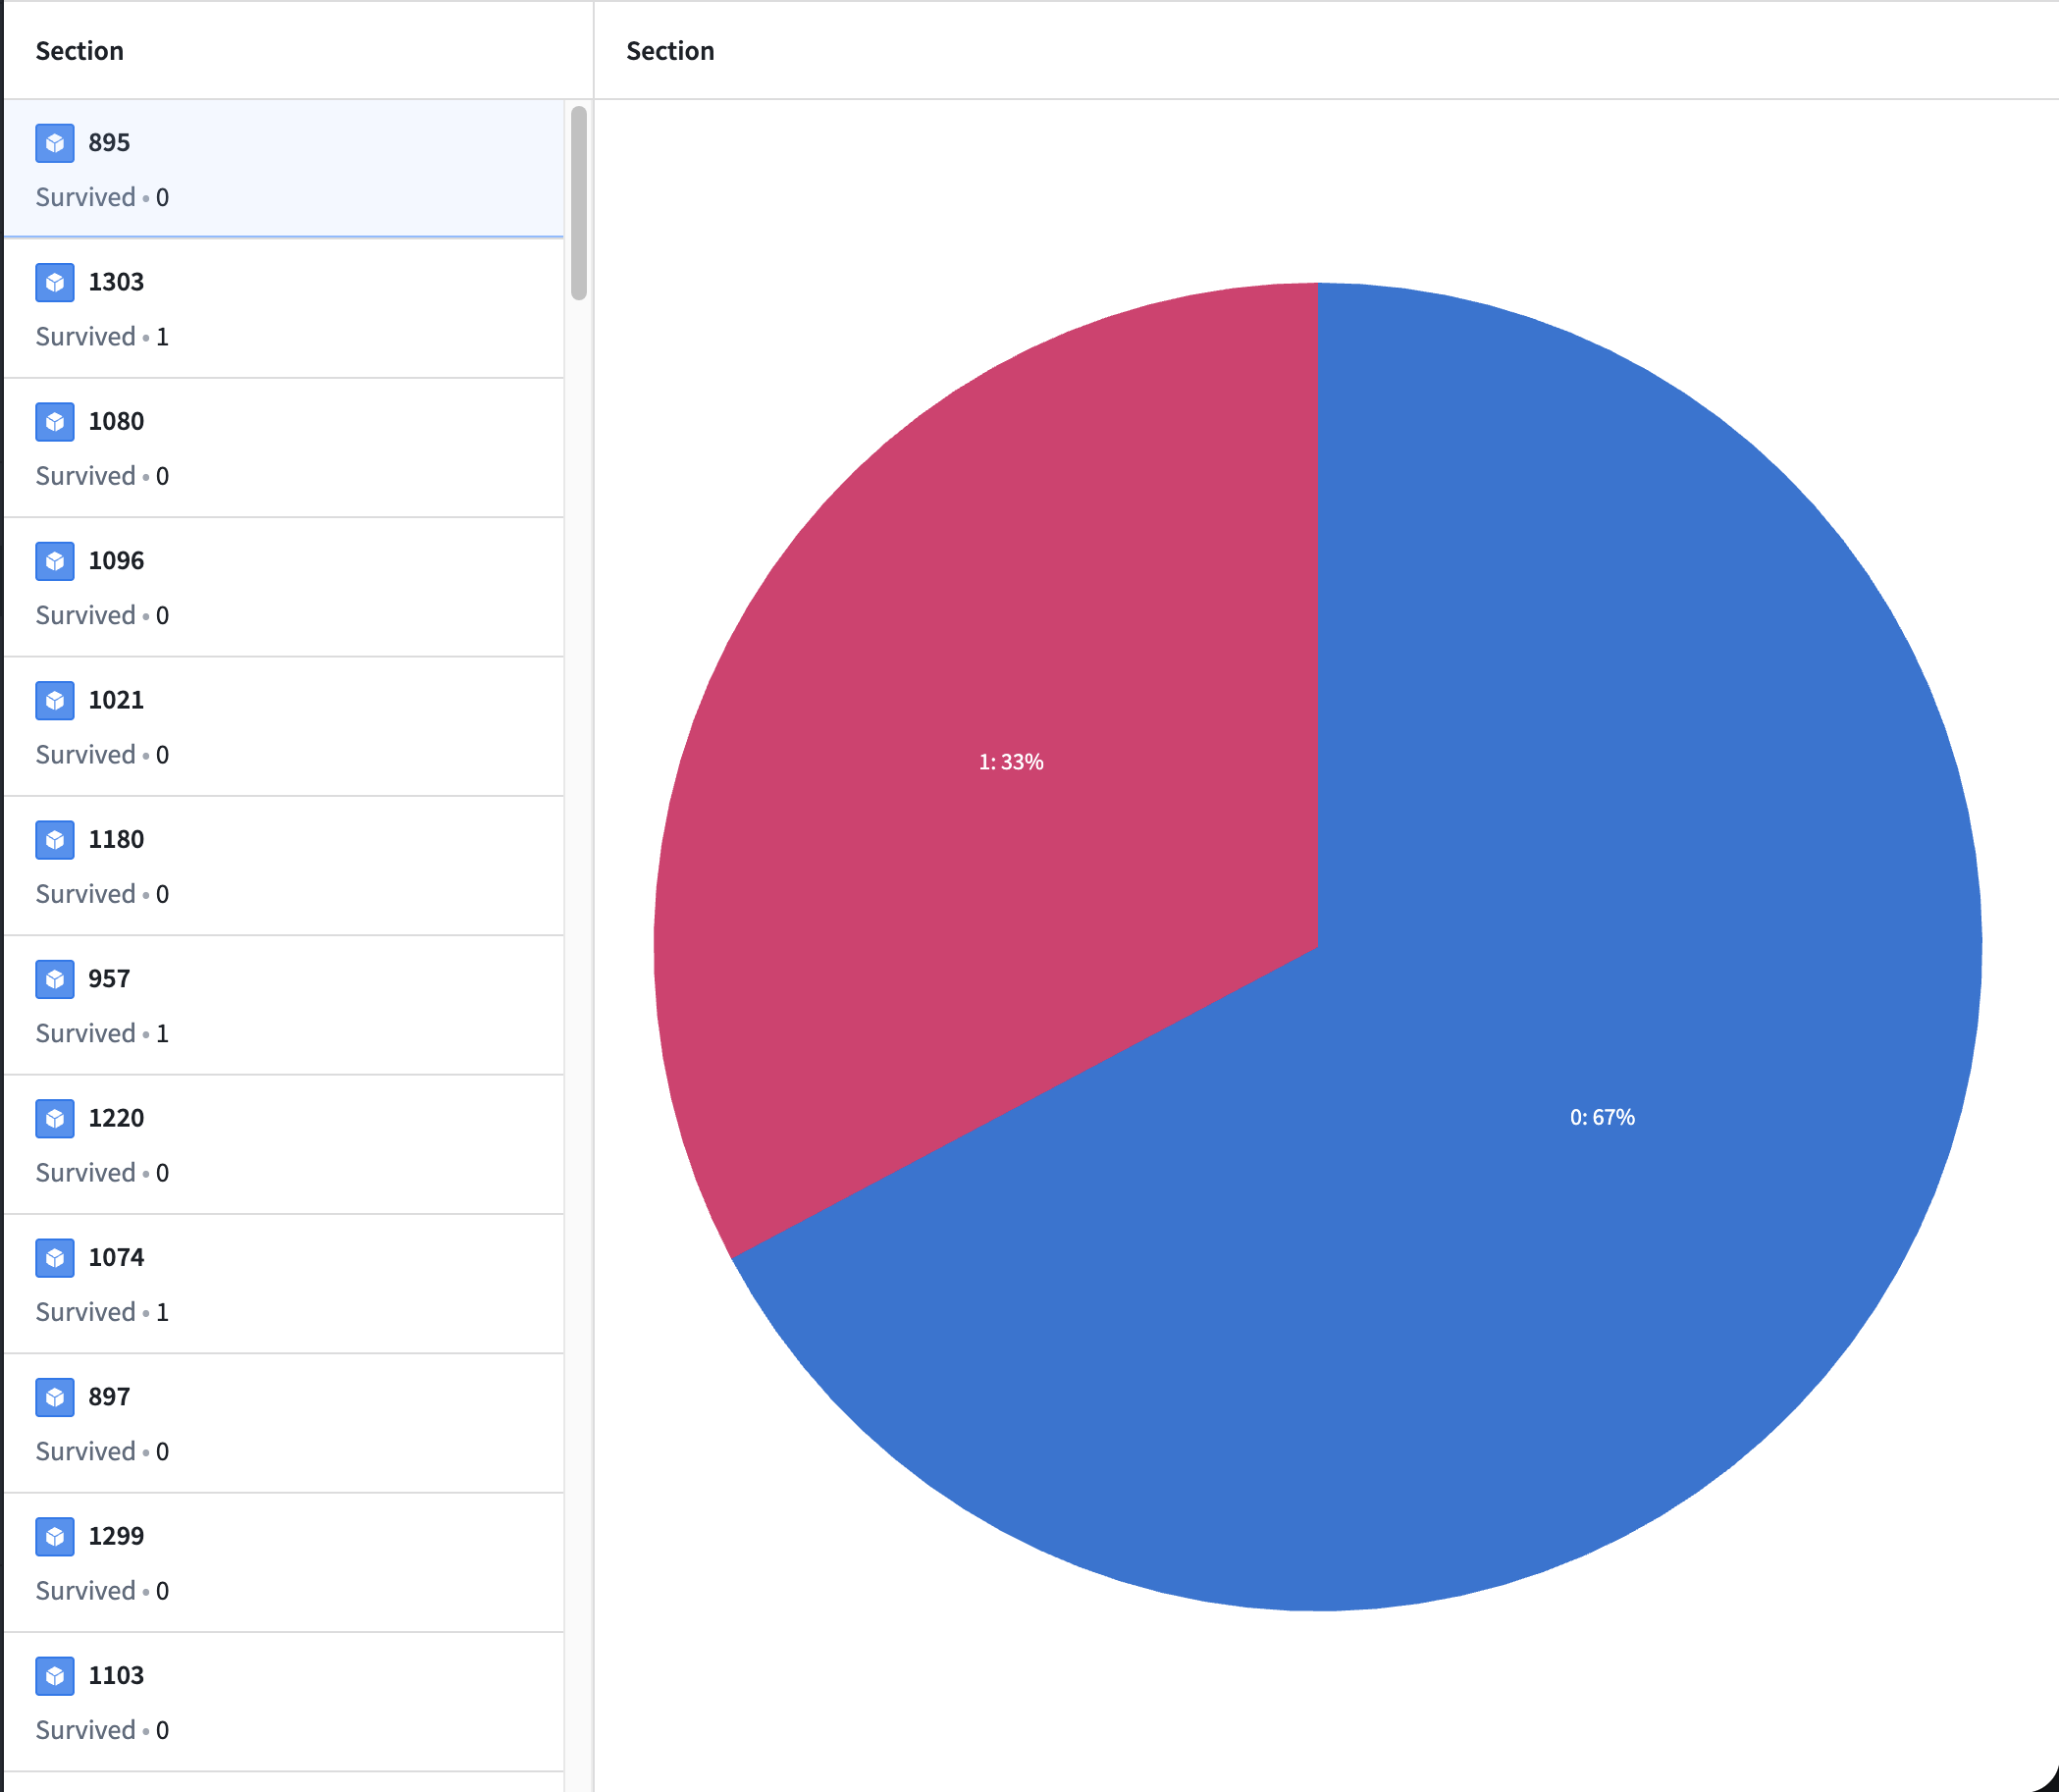
Now you can see whether each passenger survived or not in the list.
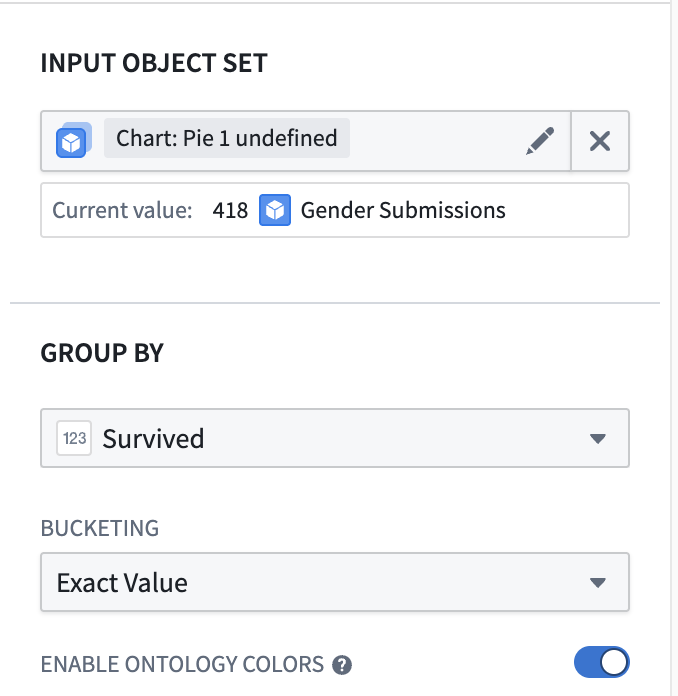
7) On the right, click Add widget → choose Chart: Pie.
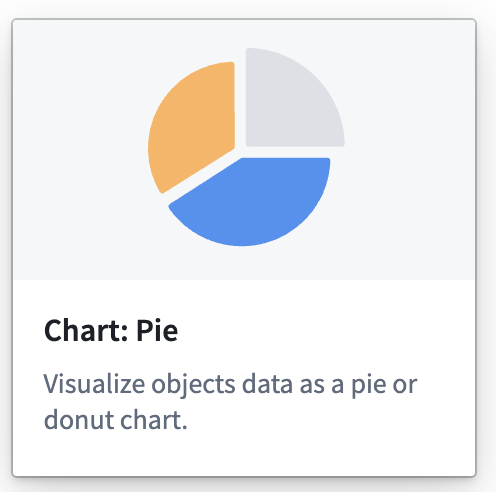
8) Set the input to gender_submission and set GROUP BY to Survived to visualize the survival/death ratio.
9) You now have a simple dashboard. If needed, you can also deploy it so others can access it.
Wrap-up
This completes the Kaggle Titanic project workflow in Foundry—from preprocessing → training/prediction → Kaggle submission → dashboard visualization. In the next post, we can extend this by improving model performance (feature engineering, validation strategy, and model comparisons).