[Palantir Foundry] Titanic Survivor Prediction Project (1/2) — Data Preprocessing
Using Palantir Foundry's no-code Pipeline Builder, we upload the Kaggle Titanic dataset, handle missing values, and perform feature engineering to get the data ready for modeling.
In this post, we’ll use Kaggle’s classic beginner dataset—Titanic: Machine Learning from Disaster—and walk through how to create a project in Palantir Foundry and preprocess the data using Pipeline Builder (no-code) up to the point where it’s ready for modeling.
Table of contents
- 1. Create and configure a project
- 1.1 Create a new project
- 2. Upload the data
- 3. Preprocess data with Pipeline Builder
- 4. Handle missing values (Age)
- 4.1 Compute the mean age
- 4.2 Join the mean back to the original rows
- 4.3 Fill Null Age with Mean_Age
- 4.4 Drop the temporary Mean_Age column
- 5. Handle missing values (Embarked)
- 6. Feature engineering
- 6.1 Family size
- 6.2 Extract title from name
- 6.3 Encode categorical values (Sex)
- 7. Write out the cleaned dataset
- Wrap-up
1. Create and configure a project
1.1 Create a new project
First, create a workspace for this work.
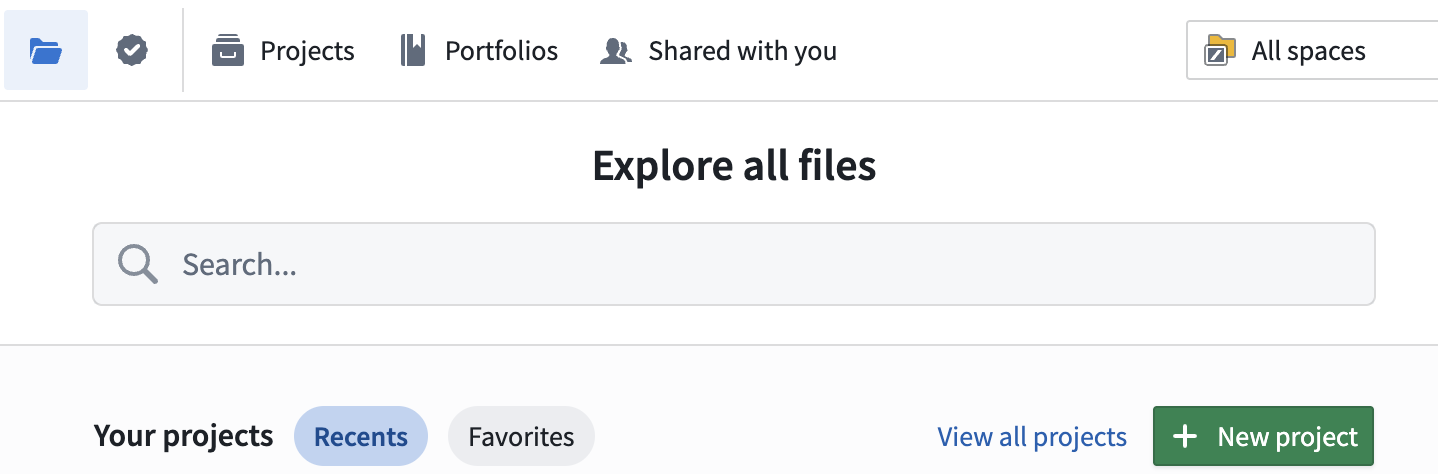
- Click New project to start creating a project.
- On the template selection screen, choose Production project (recommended for collaboration and access control).
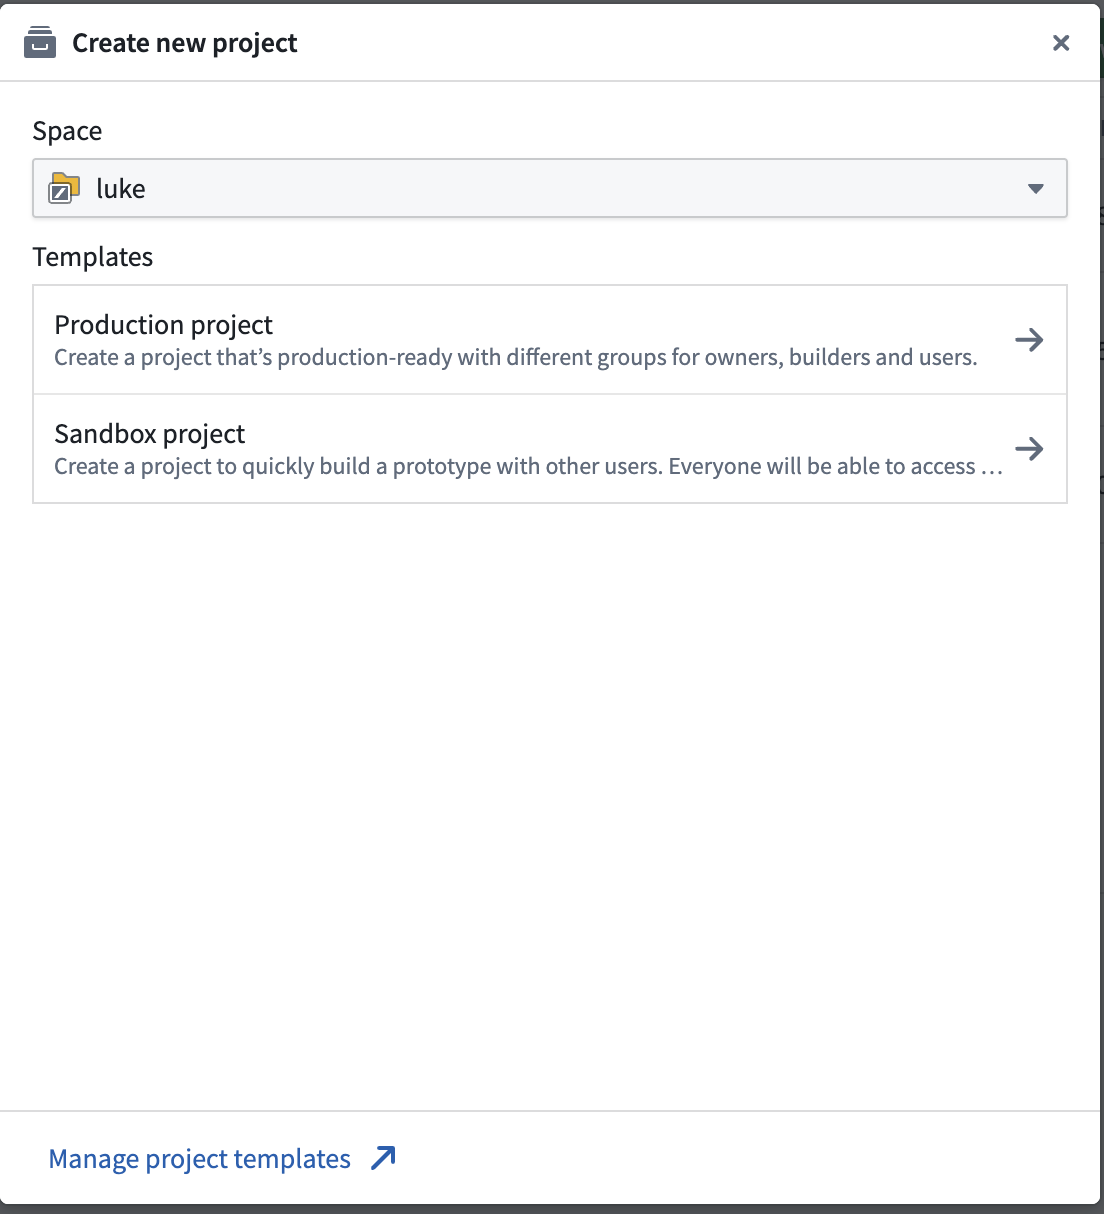
- Set the project name to something clear, e.g.
Titanic, and create the project.

2. Upload the data
Once the project is created, bring in the data you want to analyze. From the Kaggle Titanic competition page, download the following three files:
train.csvtest.csvgender_submission.csv
Kaggle competition page: Titanic - Machine Learning from Disaster
In your Foundry project:
- Click + New

- Click Upload files and upload all three files.

- When prompted for the data format, select Upload as individual structured datasets (recommended). This converts CSV (structured) files into Foundry datasets that are immediately usable.

3. Preprocess data with Pipeline Builder
Now it’s time to transform the data. We’ll use Pipeline Builder, which lets you build logic without writing code.
- Click New

- Select Pipeline Builder.

- Keep the defaults (Batch pipeline, Standard mode) and click Create pipeline.

Next, add your input dataset:
- Click Add Foundry data
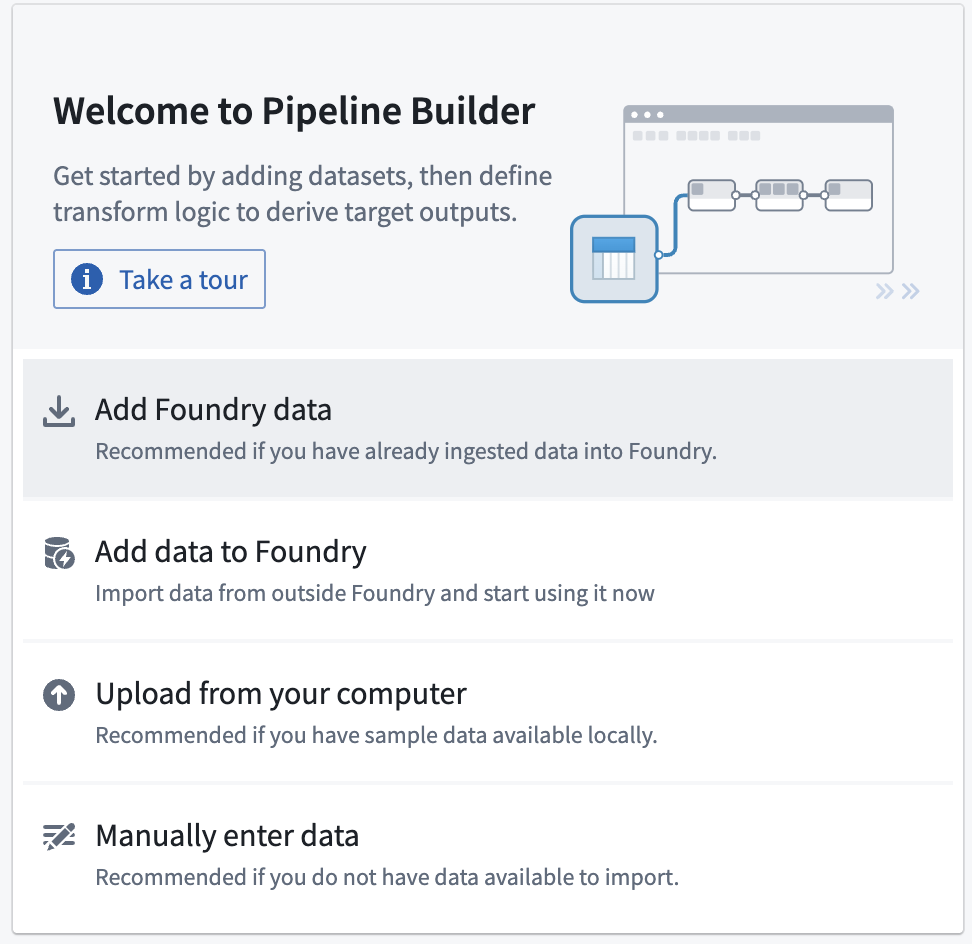
- Select the uploaded
traindataset.

- Click Add data

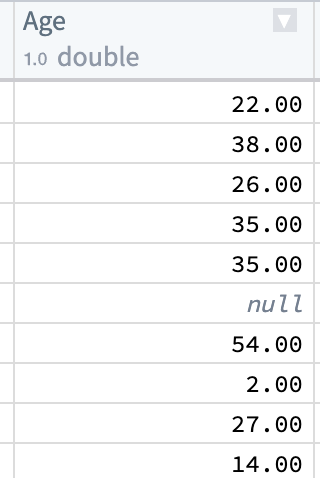
4. Handle missing values (Age)
If you inspect the data, you’ll notice missing (Null) values in the Age column. Instead of dropping those rows, we’ll fill missing Age values using the overall mean age.
4.1 Compute the mean age
- From the
trainnode, choose Transform.

- Click Aggregate.

- Set Aggregations: ‘Mean’, Expression:
Age, Output:Mean_Ageand clickApply.

- Confirm the output, then
Close.

4.2 Join the mean back to the original rows
Now we need to attach the computed mean age (≈ 29.7) to each row in the original dataset.
- Select the
trainnode, then click Join.

- Click Transform path → Start (Left:
train, Right:Transform path)

- Set Join type to Cross join, then click Apply and Close.
- This appends the same
Mean_Agevalue to every row.

You should see Mean_Age added at the far right of the table:

4.3 Fill Null Age with Mean_Age
We’ll create logic that says: If Age is null → use Mean_Age, Else → keep the original Age
- From the Join node, click Transform.

- Choose Case.

- Condition:
Is null, Expression:Age

- true(next to ‘is equal to’), Then:
Mean_Age, Else:Age, Click Apply.

Apply this so the Age column is overwritten with the filled value.
4.4 Drop the temporary Mean_Age column
After filling, Mean_Age is no longer needed. To keep the dataset clean:
- Use Apply Multiple expressions to exclude
Mean_Ageand keep the remaining columns.
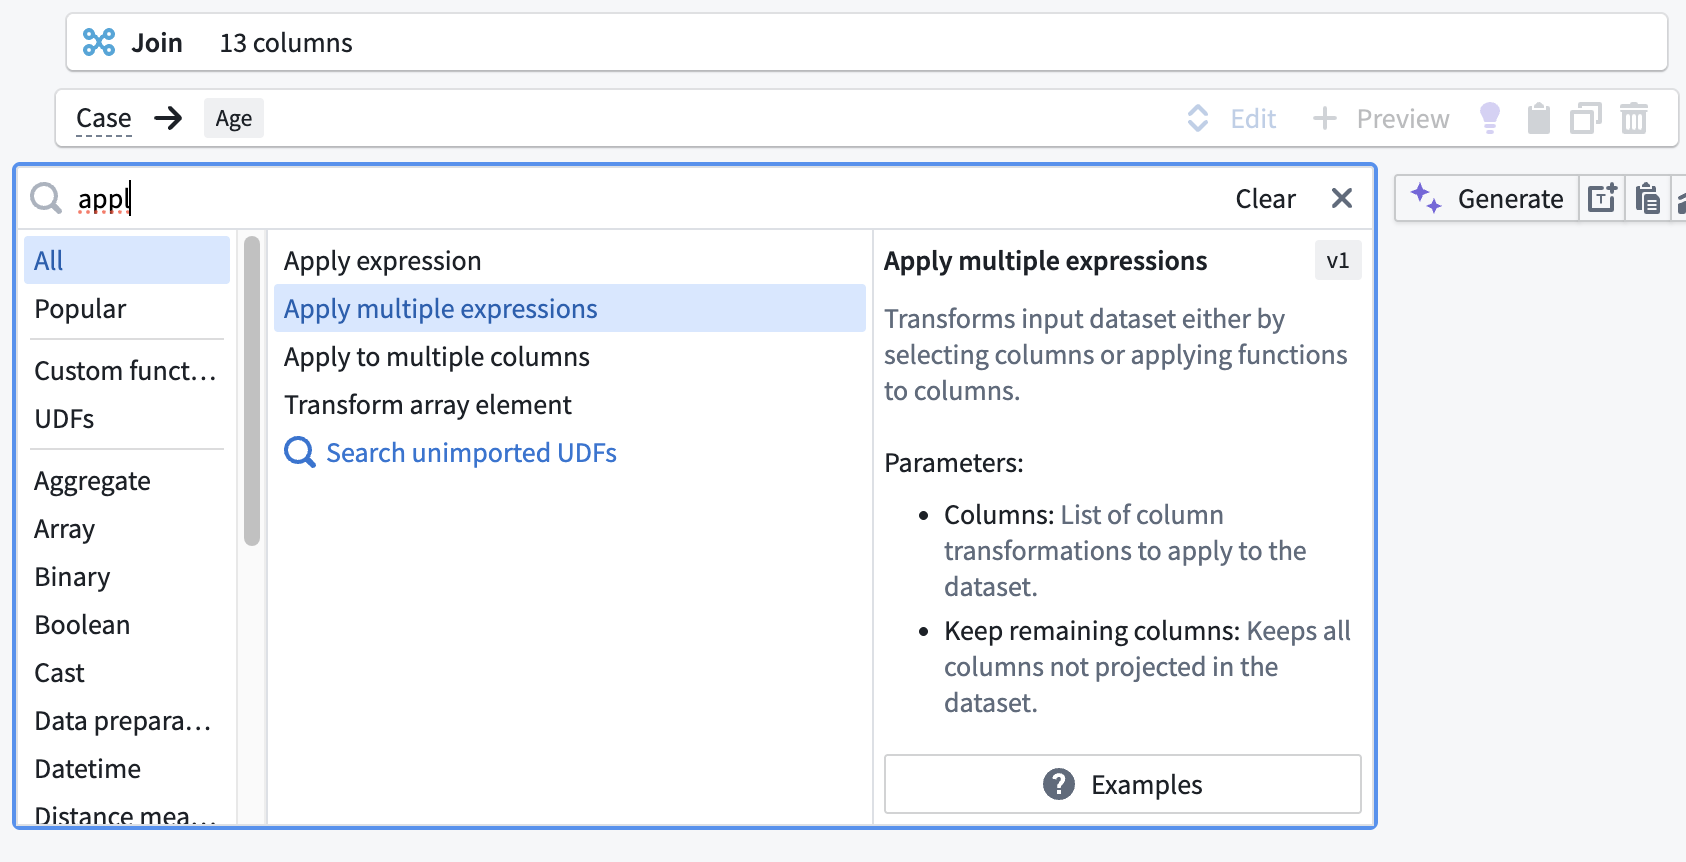
- Click Add item, select everything except
Mean_Age, uncheck Keep remaining columns, then click Apply.

5. Handle missing values (Embarked)
When you check the distribution of Embarked, you’ll typically find that S (Southampton) is the most frequent value. We’ll fill missing Embarked values with the mode: S.

- Choose Case.

- Condition:
EmbarkedIs null - Then:
"S"(a literal string) - Else:
Embarked - Click Apply.

6. Feature engineering
To improve downstream model performance, let’s create a few additional columns from existing data.
6.1 Family size
SibSp: number of siblings/spouses aboard the TitanicParch: number of parents/children aboard the Titanic
we can estimate how many family members were traveling together. We’ll also add 1 to include the passenger themself.
- Click Add numbers.

- Expressions:
SibSp,Parch,1 - Output:
FamilySize - Click Apply.

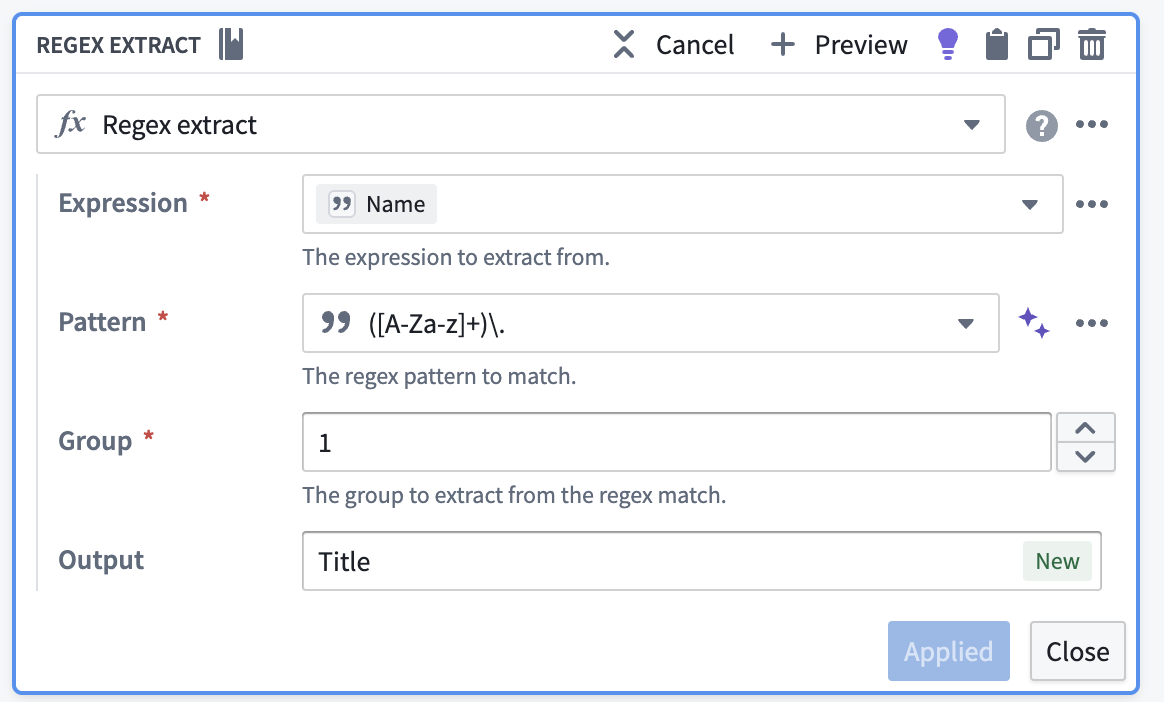
6.2 Extract title from name
We can extract the honorific (e.g., Mr, Mrs, Miss) from the Name field using a regex.
- Click Regex extract.

- Expression:
Name - Pattern:
([A-Za-z]+)\. - Group:
1 - Output:
Title - Click Apply.
6.3 Encode categorical values (Sex)
Machine learning models typically work better with numeric features than raw strings. Let’s convert Sex (male, female) into a numeric column.
- Choose Case.

- If
Sex == "male"→1 - If
Sex == "female"→0 - Else →
Null - Set Output to
Sex_Encoded, then click Apply.

7. Write out the cleaned dataset
Once preprocessing is complete, save the final dataset for modeling.
- Click Add output.

- Click New dataset.

- Set the dataset name to
titanic_cleaned_train.

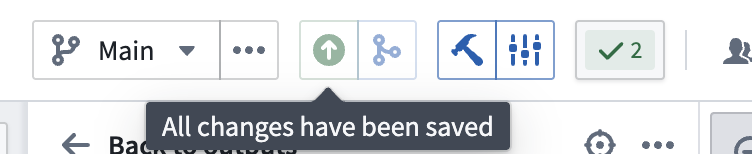
- Click the green upward arrow (save all changes).
- Click Deploy → Deploy pipeline.

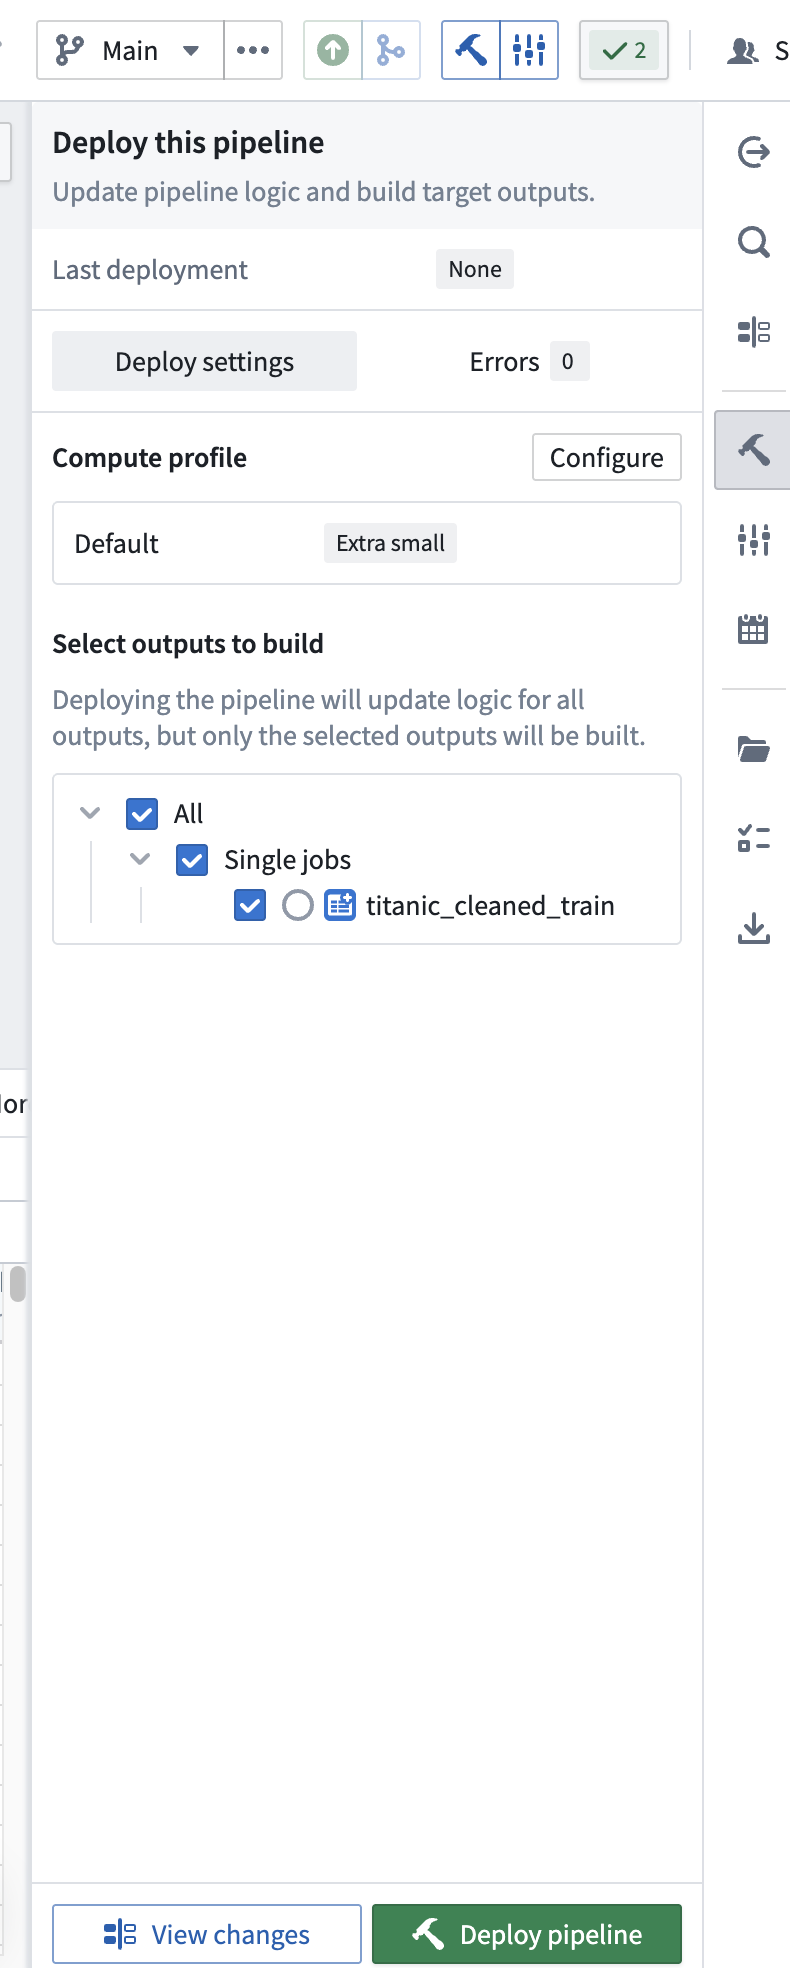
After a short wait, the pipeline deployment should complete successfully (Successfully deployed pipeline), and you’ll have a clean, processed dataset ready for training.

Wrap-up
Today we used Pipeline Builder to preprocess the Titanic dataset without coding: filling missing values, creating derived features, and encoding categorical data. In the next post, we’ll take the resulting titanic_cleaned_train dataset and move on to training a machine learning model and visualizing survival predictions (Workshop).